This page is a translation of the Dutch original.
|
|
US Markets Editorial
Massive 'short squeeze', Nvidia lower on scandal
Morning update Tuesday 10 November 2026
|
|
Three times in 4 trading days a move of at least 1,000 points for the Dow Jones. It is something we barely ever see on Wall Street, but as I often say: the markets go in all directions, and often at moments when you don't even expect it. On Monday the buyers came back in force, partly through FOMO behavior, the S&P 500 gained 2.35% and the chip sector rebounded the hardest with 6.85%. To me that is a textbook example of how quickly sentiment can flip right now, which is why I prefer to look at the price itself rather than the feeling of the last session. I mainly follow whether the support at the Nasdaq 100 holds and whether the AEX and the S&P 500 get above their resistance, before we choose a direction ourselves. Today the US inflation figure for October is on the agenda at 14:30, a number that could easily test this recovery again. These markets are a real psychological challenge. Yesterday, for example, I went through a train of thought 3 times and had to make a decision with myself. In the morning I briefly felt a pull toward short, then around the low of the Nasdaq 100 I wanted to go long, and during the day, when the indices were already more than 1% higher, I again had a thought of short positions.
But in hindsight it is better that I did nothing, given how the rest of the session went. Only that long around the bottom would have been a bullseye, but that momentum was certainly not good, since the Nasdaq 100 headed back toward the bottom and then there was also the story around Nvidia, which is still the 2nd largest company in the world.
|
|
3rd jump of 1,000 points in 4 days for the Dow
On Monday the Dow Jones made its 3rd move of at least 1,000 points in 4 trading days. A falling oil price, cheaper gasoline and a revival in the chip sector drove prices sharply higher, while at the S&P 500 as many as 432 of the 500 companies closed in the green, the broadest gain in 1 session this year. Last week's sharp drop was the toughest session for the S&P 500 since the trade tariffs of April 2025.
Still, not every stock joins the rally. Nvidia even fell 4.27% on Monday and is now 22% below its peak of roughly a month ago, after its own board announced an investigation into an alleged foreign intelligence operation involving CEO Jensen Huang. According to the board there is no indication that trade secrets or national security are at stake, and Huang is cooperating with the investigation himself. Of course you never know what all came up on the table in China.
The fact that almost the entire market moves along, while 1 of the heaviest weights of the AI rally lags behind, points to a recovery that is more broadly supported than last week's decline. The matter surrounding Nvidia remains isolated within the sector for now. Other chip names of course benefit from that.
|
|
Chips recoup most of last week, SOX gains 6.85%
Wall Street thus closed sharply higher on Monday, with the Dow Jones gaining 2.15% to 52,390 points, the S&P 500 rising 2.35% to 7,550 points and the Nasdaq Composite climbing 2.74% to 25,253 points. The Nasdaq 100 did slightly better with a gain of 3.40% to 27,908 points, while the chip index SOX gained the most with a plus of 6.85% to 10,034 points. The smaller Russell 2000 gained 3.15%.
The chip names in particular led the way. Advanced Micro Devices climbed 13.26% to $508.58 and Broadcom gained 8.78% to $319.48. Micron Technology rose 6.25% to $733.15. Nvidia was the exception with a loss of 4.27% to $178.67. Outside the chip sector Tesla gained 5.54% to $378.05, while Space Exploration Technologies closed 5.81% higher at $142.07.
The 10 year yield stands at 4.88% and the 30 year yield at 5.28%. Gold trades at $4,132, a rise of about 0.4%, and silver at $53, about 0.65% higher. Bitcoin trades at $74,700, which is slightly higher. Brent oil stands at $91 per barrel this morning, a decline of about 1.8%.
The broad gain at 432 of the 500 components sets this session apart from earlier rebounds that mainly rested on a few big names. That the chip index SOX is the strongest riser fits a technical reaction to the earlier oversold condition of this sector.
|
|
|
|
Our results of the past 12 months
| Month | Result |
| November 2025 | €3,801 |
| December 2025 | €1,204 |
| January 2026 | €151 |
| February 2026 | €3,202 |
| March 2026 | €2,197 |
| April 2026 | -€940 |
| May 2026 | €1,268 |
| June 2026 | €601 |
| July 2026 | €837 |
| August 2026 | €931 |
| September 2026 | €896 |
| October 2026 | €1,506 |
| November 2026 (interim figure 7 November) | -€608 |
| Total up to and including the interim figure of November 2026 | €15,046 |
Past results offer no guarantee for the future.
|
|
AEX and DAX ride along on the chip rebound
The AEX closed 0.84% higher on Monday at 1,130 points. The DAX gained 1.73% to 26,267 points, partly thanks to the strong gains in the German chip and tech names.
ASML climbed 4.69% to €1,343.80 and ASM International 3.38% to €673.00, both riding along with the US chip recovery. BE Semiconductor Industries (BESI) gained 2.51% to €147.00. Adyen was the exception with a loss of 2.27% to €880.70, and Shell lost some ground as well. On the DAX, Siemens gained 2.79% to €271.00 and Infineon even 6.27% to €48.63.
|
|
Agenda and outlook today
US futures point higher across the board this morning. The futures on the Dow Jones and the S&P 500 are higher, the Nasdaq 100 is a little lower. In Europe the DAX future is higher, and the AEX future also points to a higher open.
On the agenda today is mainly the US inflation figure for October, with core inflation and headline inflation at 14:30 our time. The market expects headline inflation to rise to 3.9% on an annual basis. Later in the day an auction of 10 year US government bonds follows. D-Wave and CoreWeave report figures today.
|
My view on today, the fall of recency bias
After last week's blows the buyers came back in force on Monday, and it happened at lightning speed. On Thursday the AI trade still seemed to be under fire, and only 2 trading days later almost the whole market was joining the recovery again. Such big swings on both sides within 1 week show me that the market has certainly not found calm yet.
A day like this does not come around often. Since 1995 the S&P 500 rose as hard as it did now on only about 2% of all trading days, and the SOX even belongs to the best 1%. What stands out is when this happens. More than 8 in 10 of such days occurred in a market that had already been under pressure for a longer time, such as in 2002, 2008, 2009 and 2022.
It is exactly in such a phase that recency bias likes to play tricks on us. After a few red days a further decline seems self-evident, and after 1 strong day it quickly feels as if the bottom is already in. I noticed it myself yesterday, because during the session I changed my mind 3 times, from short to long and back to short, but in the end I did nothing. Every thought was a reaction to the movement of that moment, and that is the breeding ground of FOMO. You see the price rising, you feel that others are making profit and you want to belong. My experience is that the best decision on such a day is often to do nothing for a while, even if that sometimes feels quite uncomfortable.
To me, discipline also means that we do not run after the price. A missed move costs nothing, a hasty entry does. We wait for a clear signal and only step in with a fixed target and a fixed stop loss. At Trading no positions are currently open, so we calmly keep watching whether room appears for something new.
Above all we try to find the right momentum to send our signals to members by e-mail and SMS. Everyone then decides for themselves which positions are followed and which positions fit their own risk profile. Members must always enter the positions with their own broker themselves.
If you want to follow our updates and positions, become a member via the offer you see in this update.
|
|
The psychology behind this market
A change of mood like Monday's, from unrest to relief within 2 trading days, is a textbook example of recency bias. The brain gives the most weight to the latest event, so that a series of red days feels like the new normal and 1 strong session is seen as a turning point. Both impressions say little about tomorrow on their own.
From the coaching role at Guy Systeem Trading this pattern comes back regularly after a week with big swings in both directions. Discipline and a predetermined plan remain the best counterweight there.
“An investor's memory is rarely longer than the last session, but the price couldn't care less.”
|
|
Technical view AEX
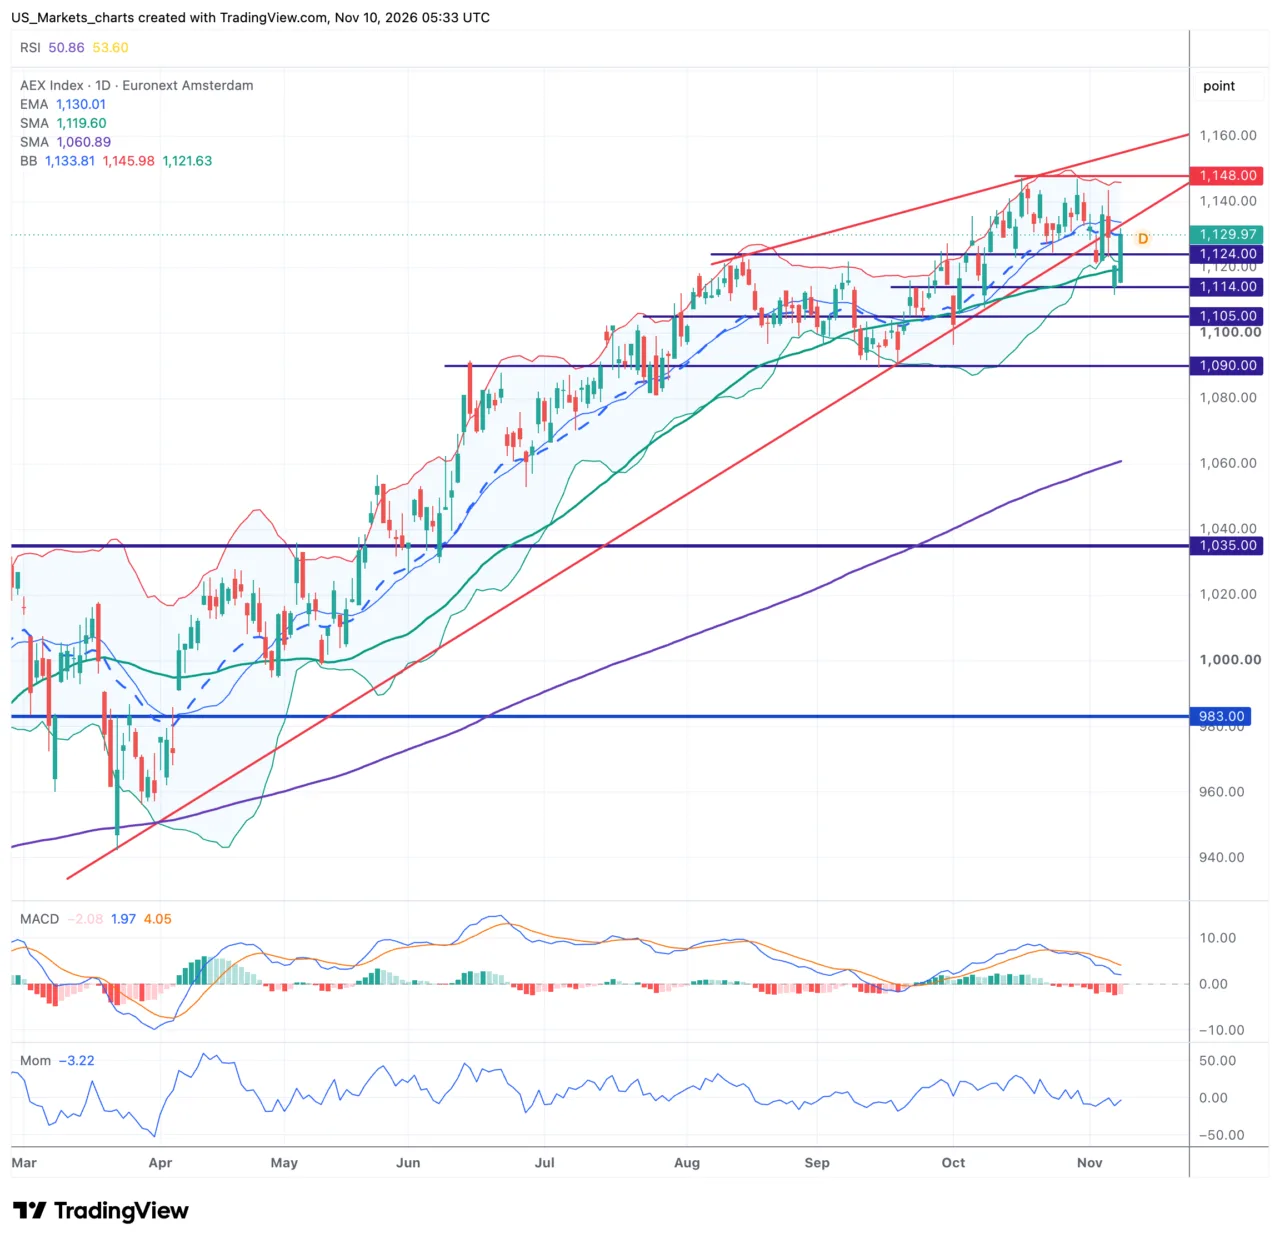
The AEX closed Monday at 1,130 points, after a session between a high of 1,132 and a low of 1,115. The index is therefore testing the EMA-20, at 1,130, and holds the SMA-50, at 1,120, as support under the price. The SMA-200, at 1,061, stays far below the price and confirms the longer rising trend. The price trades in the lower half of the Bollinger Band, not far from the bottom, a sign that the decline of the past days has not been fully absorbed yet.
Click the chart to view it in full size.
In short. The SMA-200 stays far below the price, so the longer trend remains rising
On Monday the price bounces sharply from the support at the SMA-50.
The price does not yet clearly get above the EMA-20.
The MACD is below the signal line and the momentum is still slightly negative.
The AEX remains in a rising trend on the daily chart, with the SMA-200 still far below the price. In the shorter term the index moves sideways between support at 1,120 and resistance at 1,148, with the price bouncing back today from the bottom of that band. No clear chart pattern is visible, the move fits best with a trading range.
For the coming sessions a test of the resistance at 1,143 is likely if the price stays above the EMA-20. We see a rebound from the support at the SMA-50, with 1,120 as the 1st level that invalidates this picture on a new decline. If the price closes below that level, the SMA-200 only comes into view much further down.
|
|
Technical view Nasdaq 100
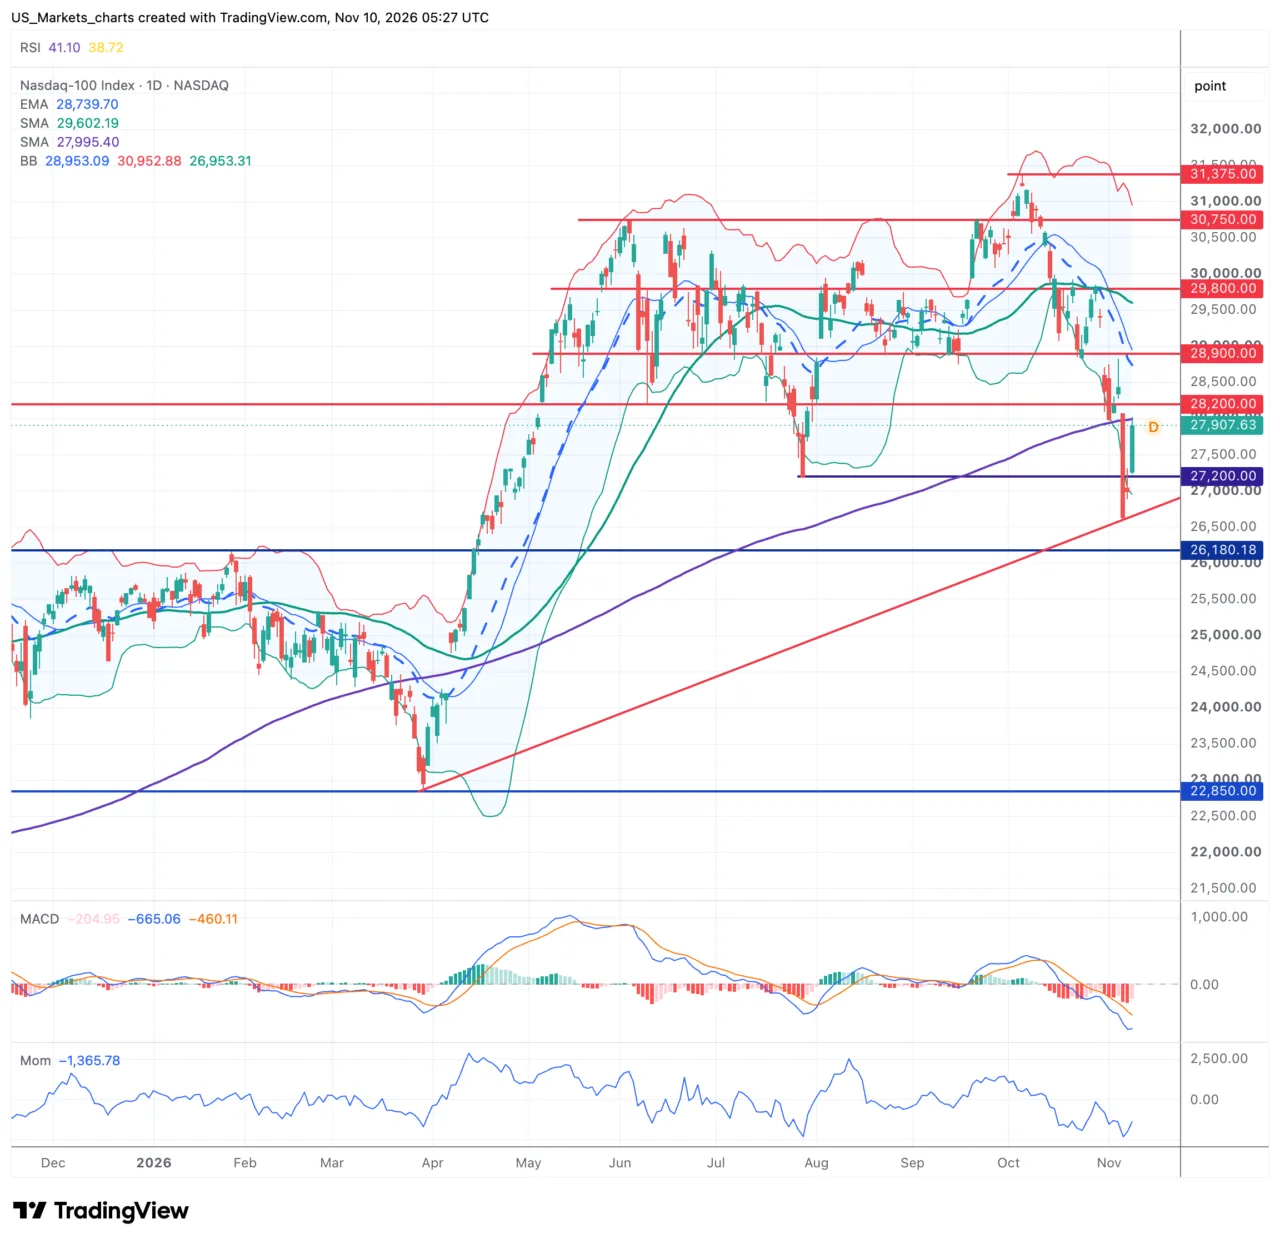
The Nasdaq 100 closed Monday at 27,908 points. The index is therefore still just below the SMA-200, at 27,995, the signal of an official correction. The EMA-20, at 28,740, and the SMA-50, at 29,602, both still lie far above the price and so form solid overhead supply. The price trades in the lower half of the Bollinger Band, at a good distance from the bottom, after last week's sharp drop.
Click the chart to view it in full size.
In short. Helped by the strong chip sector, the index gained 3.4% on Monday
The RSI moves away from last week's oversold area.
The price does not yet get above the SMA-200 and technically remains in a correction
The MACD and the momentum remain negative, without a confirmed turning point.
Since last week the Nasdaq 100 has technically been in a correction, with the price just below the SMA-200. After last Thursday's sharp drop the index is now testing the support zone around 26,900, where the price turned twice last week. A clear chart pattern is missing, the move looks mainly like a fast, volatile decline with an equally fast recovery.
For the coming sessions a further test of the SMA-200 at 27,995 is likely, which now acts as resistance. If the price gets above it, the zone around 29,000 comes into view as the next hurdle. The price can slip away again after a test of the resistance if there is no breakout, and a close below 26,900 would weaken the picture further.
|
|
Technical view S&P 500
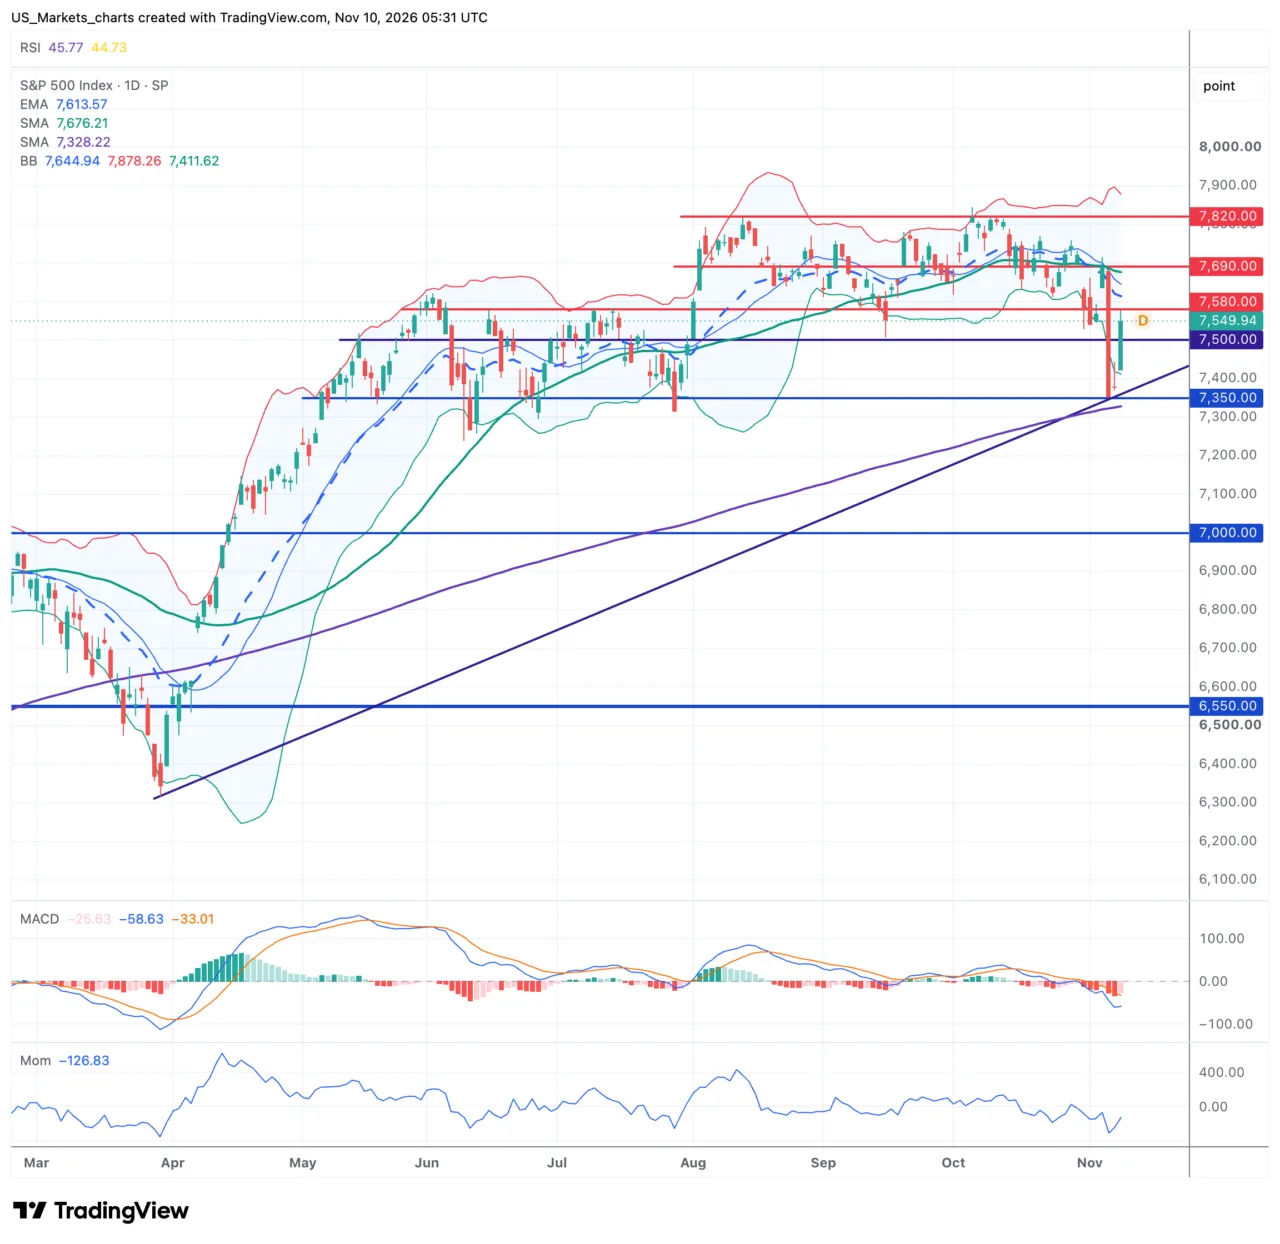
The S&P 500 closed Monday at 7,550 points, after a session between 7,577 and 7,422 points. The index is still above the SMA-200, at 7,328, but below the EMA-20, at 7,614, and the SMA-50, at 7,676. The price trades in the lower half of the Bollinger Band, at some distance from the bottom, after Monday's strong recovery.
Click the chart to view it in full size.
In short. The price stays above the SMA-200, so the longer rising trend is not at stake.
The S&P 500 recovers 2.35%, a broadly supported session with 432 advancers.
The price does not get above the EMA-20 and the SMA-50, which remain resistance
The MACD stays below the signal line and the momentum remains negative for now.
On the daily chart the S&P 500 remains above the SMA-200 and thereby keeps the longer rising trend intact, although the direction in the shorter term is corrective. The support at 7,350, where the price turned twice last week and which lines up with the SMA-200, held last week. No clear chart pattern is visible, the index does move in a broad, volatile range.
For the coming sessions a test of the resistance at the EMA-20 around 7,614 is likely. If the price gets through there, the SMA-50 at 7,676 follows as the next hurdle. The support holds at 7,350, the level that only invalidates the positive scenario on a new decline.
|
Disclaimer: All information in this update has been checked as well as possible, but a lot is nowadays generated with the help of AI, so some mistakes may still have slipped in. This update is not investment advice. Investing involves risk and you can lose (part of) your capital.
Sources:
TradingView, Investing.com, Yahoo Finance, MarketWatch, usmarkets.nl.
US Markets Editorial | www.usmarkets.nl
|
|