This page is a translation of the Dutch original.
|
|
US Markets Editorial Team
Dow drops below its 200 day average, Anthropic heads to Nasdaq
Morning update Thursday 19 November 2026
|
|
What is on my mind this morning is how the market is searching anxiously for a support point and not finding one easily. The Nasdaq and the SOX are still defending their most recent low for now, but the Dow Jones dropped through several important support levels yesterday and ended up in an older support and resistance zone. For the first time since March this year, this previously stronger index closed below the SMA-200, a level that the SOX and the Nasdaq 100 have been below for longer. Nvidia could not get back on its feet after otherwise solid results and lost almost 3% again, and that brake continues to weigh on the whole chip sector. That is exactly where I see an opportunity emerging in the coming sessions, for example via the Semiconductor ETF or via the technology indices themselves, as soon as the momentum really calls for it. This morning we again see plenty of volatility, especially in technology, with the future on the Nasdaq 100 already moving about 400 points. On top of that, Anthropic debuts on the Nasdaq today, with an opening around $83 that immediately sets the bar quite high. After closing our positions, this month ends up in profit on balance, while we calmly wait for clearer momentum to step in.
|
|
Tech sector in biggest reversal in years, Anthropic heads to the stock market
According to figures that MarketWatch released this week, the healthcare sector beat the technology sector over the past 100 trading days by more than 33 percentage points, the biggest reversal since October 2001. Investors are thus leaving the most expensive corner of the market and seeking refuge in more defensive names.
It stood out that the copper price took a hefty hit this week, which according to market analysts points to doubt about the pace at which tech companies keep expanding their data centers.
Fed governor Christopher Waller hinted this week that he favors a tighter course, and the market is already pricing in a probability of about 99% for a 25 basis point rate hike in December.
For the first time since spring, the Dow Jones closed below the 200 day average on Wednesday, a level that the chip index SOX and the Nasdaq 100 have been trading below for longer. Nvidia came out with results after the close on Tuesday that beat expectations, but the stock still lost almost 3% again, amid persistent uncertainty about the company's governance.
Today Anthropic makes its debut on the Nasdaq under the ticker symbol ANT, after a listing that according to the latest reports stands at $83 per share.
That the rotation from technology to healthcare is already the biggest in 25 years suggests that investors are starting to judge the AI driven rally more critically. The weakness in copper and the harder tone from the Fed come on top of that, just as a very high profile AI IPO presents itself to the market.
|
|
Wall Street mixed, chip names far apart
Wall Street closed mixed on Wednesday. The Dow Jones lost 1.11% to 50,203 points and the S&P 500 gave up 0.23% to 7,324 points. The Nasdaq Composite, on the other hand, gained 0.42% to 24,430 points and the Nasdaq 100 also rose 0.42% to 27,116 points. The chip index SOX was 0.10% higher at 9,653 points and the smaller Russell 2000 gained 0.46%. The fear index VIX meanwhile fell 3.54% to 24.55, a striking contrast with the loss at the Dow.
Nvidia lost 2.89% to $150.96, despite results that beat expectations. Palo Alto Networks jumped almost 10% to $340 after its results, and AMD (+5.31% to $530.14), Broadcom (+3.64% to $354.05) and Amazon (+3.82% to $267.74) also gained sharply. SanDisk, on the other hand, fell 2.64% to $776.22, Micron lost 1% to $705.27 and Intel gave up 0.91% to $54.67.
In the bond market the 10 year yield stands at 5.06% and the 30 year yield at 5.40%. Gold is at $3,740, 0.05% lower, and silver is at $45.45, 0.85% higher. Bitcoin is trading around $63,600. Brent oil is trading this morning around $92.5 per barrel, 0.5% higher.
That the chip names diverge so much from each other, with Nvidia as the clear laggard and AMD and Broadcom higher, points to specific doubts about Nvidia itself rather than a broader decline of the sector.
|
|
|
|
Our results of the past 12 months
| Month | Result |
| November 2025 | €3,801 |
| December 2025 | €1,204 |
| January 2026 | €151 |
| February 2026 | €3,202 |
| March 2026 | €2,197 |
| April 2026 | -€940 |
| May 2026 | €1,268 |
| June 2026 | €601 |
| July 2026 | €837 |
| August 2026 | €931 |
| September 2026 | €896 |
| October 2026 | €1,506 |
| November 2026 (interim result 19 November) | €116 |
| Total up to and including the November 2026 interim result | €15,770 |
Rolling window of 12 closed months plus the current month as an interim result. Results are an indication based on closed positions. Past performance offers no guarantee for the future.
|
|
AEX and DAX lower, European chip names in the green
In Amsterdam the AEX closed 1.01% lower on Wednesday at 1,098.7 points, and the DAX lost 1.19% to 25,736 points. Chip names in Europe were on the winning side, in line with their American peers. ASML gained 1.94% to €1,260.80, ASM International rose 2.60% to €670.00, BE Semiconductor Industries (Besi) climbed 2.05% to €149.20 and Infineon gained 1.07% to €49.21. Prosus, on the other hand, fell 5.05% to €32.53 after its own results, ING lost 3.21% to €28.37, SAP gave up 3.76% to €193.92 and Shell fell 2.17% to €43.34.
|
|
Agenda and outlook today
The American futures point to a fair amount higher this morning for the Dow Jones, the S&P 500 and the Nasdaq 100. In Europe the futures on the DAX and the AEX also point higher.
On the macro agenda today are the weekly American jobless claims and speeches by Fed officials Hammack, Goolsbee and Paulson, supplemented by words from ECB officials Elderson and Lagarde.
On the Nasdaq, Anthropic debuts today. On the earnings front, Walmart and Alibaba report before the open, and Intuit after the close.
|
My view on today: hope for a support point and for opportunities in chips
The market is clearly searching for a support point, and that does not happen by itself. For now the Nasdaq and the SOX are still defending their most recent low, but the Dow Jones dropped through several important support levels yesterday and ended up in a zone that previously served as both support and resistance. This index, which did better this year than the rest, closed for the first time since March below the SMA-200. The SOX and the Nasdaq 100 have been below it for a while and remain there now too.
The AEX and the DAX, which did better than the American indices for a long time, are now giving back a good part of that lead. Both are trading below the EMA-20 and the AEX has now also dropped below the SMA-50.
Despite solid results, Nvidia could not get back on its feet, and the stock again lost almost 3%, which continues to weigh on the whole chip sector. I will keep a close eye on that in the coming sessions, because I see an opportunity emerging to take some long positions as soon as the momentum presents itself. The chip sector certainly comes into view, for example with a position in the Semiconductor ETF, and I also see something in the indices themselves as soon as the momentum calls for it.
The volatility continues this morning too, especially in technology. The future on the Nasdaq alone moved about 500 points between its high and its low. On top of that, the long awaited IPO of Anthropic on the Nasdaq arrives today, with an opening at $83, a level that immediately sets the bar high. By closing all our positions, this month ends up in profit on balance, which allows us to wipe out the poor start of November. We are not taking big risks. It is hard enough now that several indices are sinking further, although a bounce upward can also come out of nowhere. The downward pressure has in any case not completely disappeared, and the question for today is mainly how the market will receive the IPO of Anthropic. For now we calmly wait until clearer momentum emerges to step in.
We try to find the right momentum to send our signals to members by e-mail and SMS. Everyone then decides for themselves which positions to follow and which positions fit their own risk profile. Members must always enter the positions with their own broker themselves.
If you want to follow our updates and positions, become a member via the offer you see in this update.
|
|
The psychology behind this market
As soon as a market moves as hard as it did this week, hope quickly arises that the worst is over. That hope feels pleasant, but in itself it is not a signal. It actually tells nothing about where a support really lies or when the momentum is there to step in.
From the coaching role at Guy Systeem Trading this distinction comes up often. Hope that waits for a confirmed level, a crossed average or a clear turning point is something different from hope that only wants the decline to stop. It therefore remains important to keep patience with a plan.
|
|
Technical view AEX
The AEX closed 1.01% lower on Wednesday at 1,098.7 points and dropped below the lower Bollinger Band, a firm signal of short term pressure. The price is trading below the EMA-20, which comes in at 1,129 points, and below the SMA-50, which comes in at 1,123 points, but still well above the SMA-200, which comes in at 1,066 points. Along the way the index also broke through a rising trend line that had been below the price since the summer. The RSI is at 36, not yet in oversold territory, the MACD is below the signal line and below the zero line, and the momentum is clearly negative.
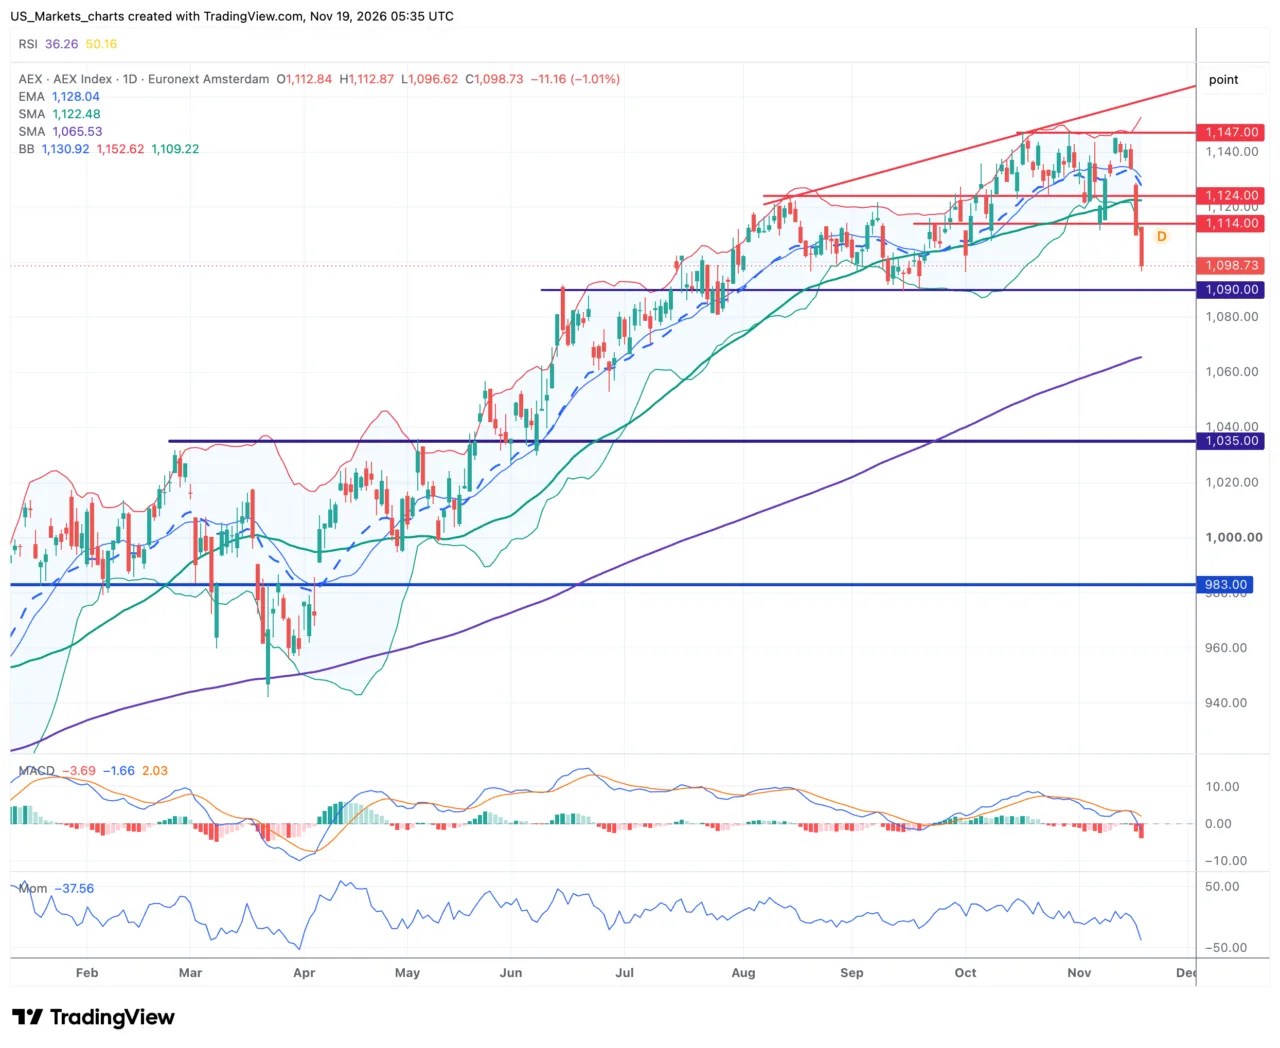
Click the chart to view it in full size.
In short.
The SMA-50 is still above the SMA-200, so the longer trend remains upward.
The zone around 1,090 caught the price several times earlier this year.
The price is now below the EMA-20 and SMA-50, a correction within the longer trend.
The price is now below the lower Bollinger Band and broke a rising trend line.
On the daily chart the AEX has been in a rising trend since the low earlier this year, with higher highs and higher lows, but the direction of the last few days is a sharp correction within that trend, including a break of the rising trend line that accompanied the price since the summer.
The support around 1,090 is only just holding, with the zone around 1,070, 1,050 and 1,035 as the next safety net below. The price is not yet getting above the resistance at 1,114, with the resistance around 1,124 above it. A clear reversal pattern is therefore not there yet, the index is mainly putting down a sharp correction.
For the coming sessions a technical rebound towards the resistance at 1,114 is likely, as long as the support at 1,090 stays intact. If the index drops sustainably below it, that is the moment that invalidates this picture, after which the support at 1,035 will be put to the test.
|
|
Technical view Nasdaq 100
The Nasdaq 100 gained 0.42% on Wednesday to 27,116 points and tested the same zone for the 2nd time in a few sessions, a possible double bottom that is only confirmed on a breakout above the intermediate high. The price is below the EMA-20, which comes in at 28,157 points, below the SMA-50, which comes in at 29,363 points, and for the first time in months also below the SMA-200, which comes in at 28,063 points. The SMA-50 is still above the SMA-200, so there is no death cross. The Bollinger Band is unusually wide, fitting the high unrest of the last few days. The RSI is at 38, not yet in oversold territory, the MACD is below the signal line and below the zero line and the momentum is clearly negative.
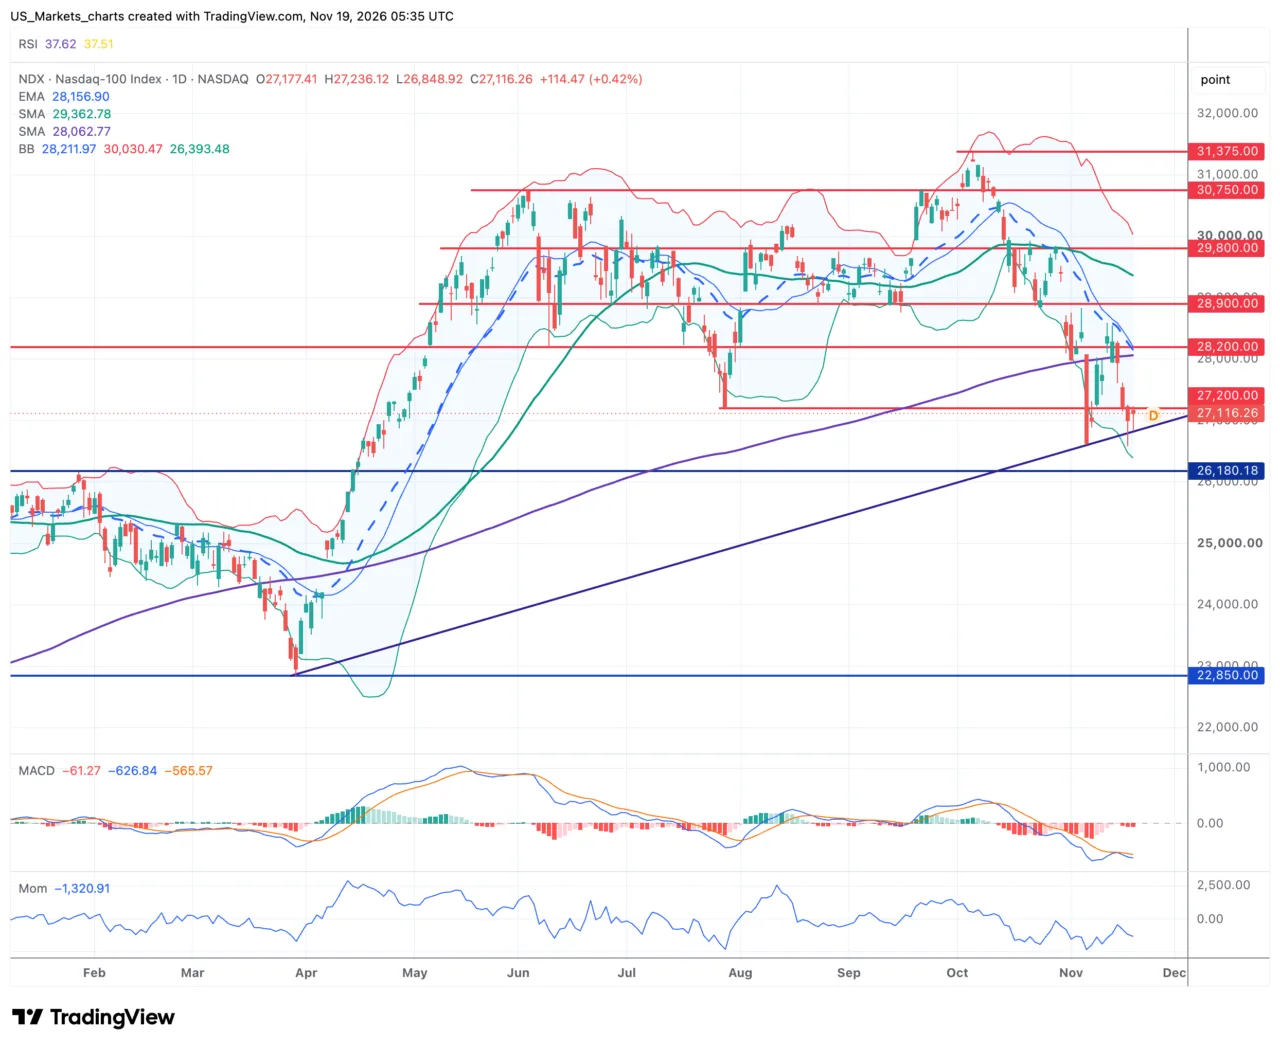
Click the chart to view it in full size.
In short.
The SMA-50 is still above the SMA-200, there is no death cross.
The price could now possibly form a double bottom.
The price closes below the SMA-200 for the first time in months.
The Bollinger Band is unusually wide, fitting the high volatility.
On the daily chart the Nasdaq 100 continues a new downward correction since the peak a few months ago, with lower highs and lower lows. The support around 27,200 is now being tested for the 2nd time, which may point to a double bottom in the making, although that pattern is far from confirmed. The price does not really get above the resistance around 27,200, with the resistance at 28,200 above it, where the EMA-20 is also located.
For the coming sessions the support at 27,200 is the level to watch. If it holds, a technical rebound towards the resistance at the EMA-20 at 28,157 is likely. If the price drops sustainably below it, that is the level that invalidates this picture, after which the support at 26,180 may be put to the test.
|
|
Technical view Dow Jones
The Dow Jones closed 1.11% lower on Wednesday at 50,203 points and thereby closed below the SMA-200 for the first time since spring, which comes in at 50,786 points. The price is also below the EMA-20, which comes in at 51,821 points, and below the SMA-50, which comes in at 51,859 points. The SMA-50 is still above the SMA-200. The price also dropped below the lower Bollinger Band and broke a rising trend line, a firm signal of short term pressure. The RSI is at 36, not yet in oversold territory, the MACD is below the signal line and below the zero line and the momentum is clearly negative.
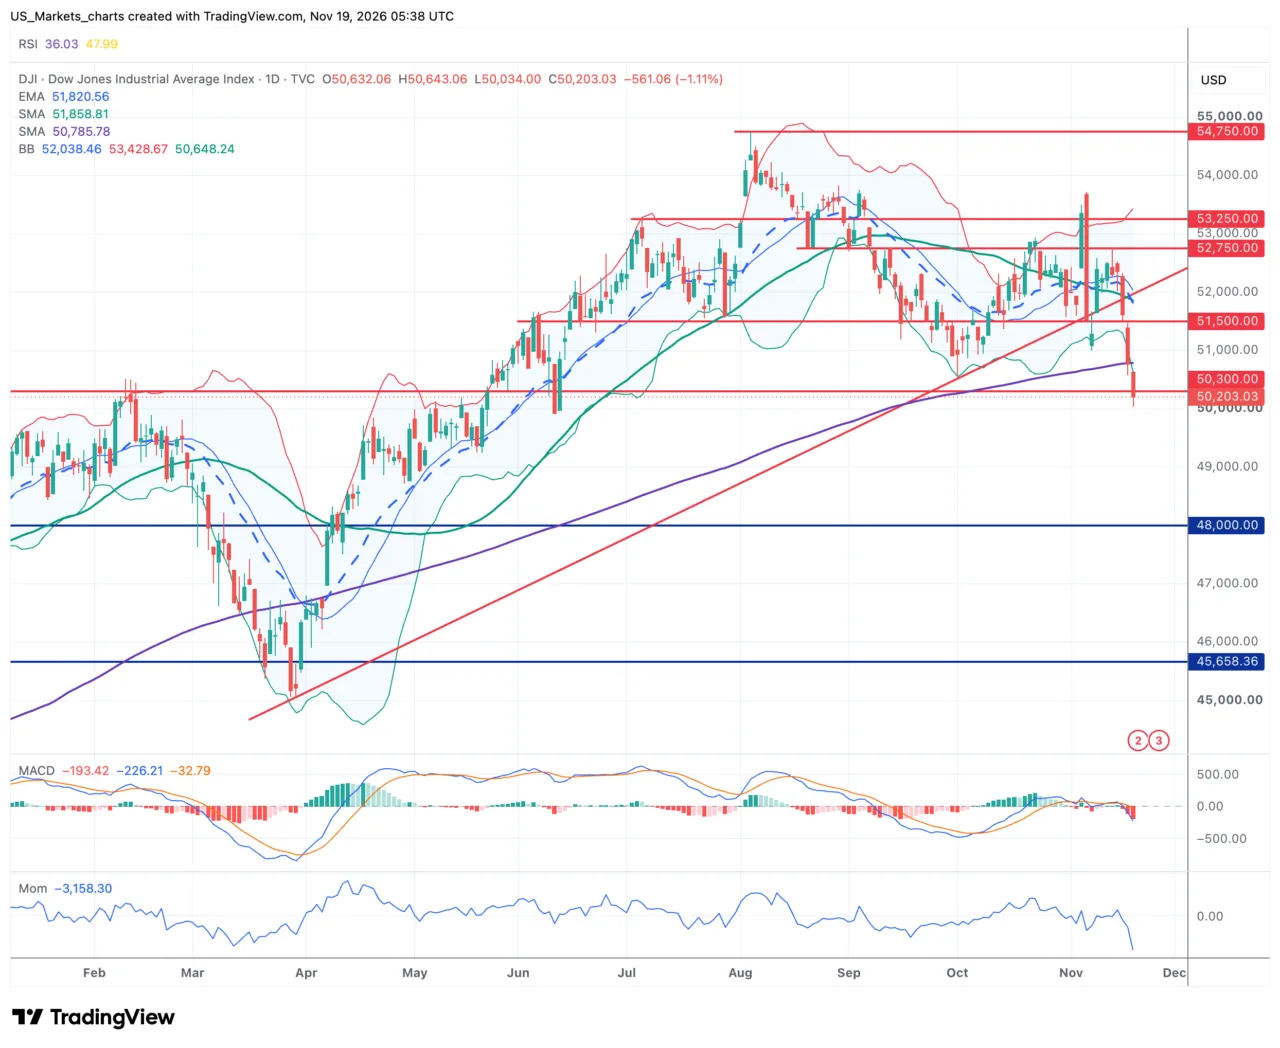
Click the chart to view it in full size.
In short.
The SMA-50 is still above the SMA-200, the longer trend remains intact.
The zone around 50,300 caught the price several times in the past.
The price closes below the SMA-200 for the first time since spring.
The price drops below the lower Bollinger Band and broke a rising trend line.
On the daily chart the Dow Jones continues a correction after the peak a few weeks ago, with a clear acceleration downward in the last few days, including a break of the rising trend line that accompanied the price since spring. There is no clear reversal pattern, rather a sharp correction that brought the index close to a more often tested zone. The support around 50,300 is only just holding, with the zone around 48,000 as the next safety net. The price is not yet getting above the resistance around 51,500, with the resistance at 52,750 above it.
For the coming sessions the position below the lower Bollinger Band can produce a technical counter move towards the zone around the SMA-200 at 50,786, as long as the support around 50,300 ultimately stays intact. A sustained close below 49,500 and 48,000 becomes the level that invalidates this picture.
|
Disclaimer:
Everything in this update has been checked as well as possible, but much of it is nowadays generated with the help of AI, so some mistakes may still have crept in. This update is not investment advice.
Sources:
TradingView, Investing.com, Yahoo Finance, MarketWatch, usmarkets.nl.
US Markets Redactie | US Markets Editorial Team | www.usmarkets.nl
|
|