This page is a translation of the Dutch original.
|
|
US Markets Editorial
Hefty CPI pushes yields above 5%, Nvidia bows further ...
Morning update Wednesday 11 November 2026
|
|
What stays with me most from Tuesday is how composed the market was in reacting to the hefty inflation figure. Core inflation and headline inflation both came in higher than expected, the 10 year yield shot above 5% and still the losses in the indices ended up limited. I personally felt no need yesterday to take a position right away, in either direction, and this morning that turns out not to be a bad choice, because the futures are higher. Swings that fast mean that if you enter now you have to be right for at least 24 hours to keep anything from it, and that is almost impossible at the moment. November has been disappointing so far, with a small loss for our signal services, but the total for this year is still well in the plus. Today I mainly look at the tension in the Middle East, at yields and at how the indices look technically, before I decide whether anything can be done.
|
|
Hefty CPI pushes yields toward 5%
US inflation for October came in higher on Tuesday than the market had priced in. Headline CPI rose 0.4% month on month against an expectation of 0.3%, and core inflation at 0.3% also exceeded the estimated 0.2%. The 10 year yield responded with a jump to 5%, while the 30 year yield climbed to 5.36%.
Fed governor Paulson of the Philadelphia Fed called the figure on Tuesday evening a sign that underlying price pressure has not gone away yet, and would want to step in faster if inflation picks up further. Secretary Bessent spoke the same evening about the trade relationship with China and about knowledge exchange in the field of artificial intelligence, a subject that remains relevant for Wall Street now that a large part of the profit growth of recent years leans on AI.
A higher than expected inflation figure feeds through into yields, and higher yields weigh above all on the valuation of growth stocks whose profits lie far in the future. The combination of those figures and the move in yields explains to a large extent why the tech heavy indices again took the biggest hits on Tuesday. The comments from the Philadelphia Fed point to a central bank that for now sees no reason to loosen its grip.
|
|
Dow, S&P 500 and Nasdaq close in the red
Wall Street closed lower on Tuesday, although the damage stayed limited after Monday's strong rally. The Dow Jones lost 0.3% to 52,232 points and the S&P 500 gave back 0.38% to 7,521 points. The Nasdaq Composite fell 0.74% to 25,066 points and the Nasdaq 100 lost 0.60% to 27,741 points. The chip index SOX kept the damage limited with a 0.35% loss to 9,998 points. The smaller Russell 2000 fell 0.68% to 2,821 points.
Nvidia was once again the biggest drag, with a loss of 5.47% to $168.89, the lowest close since the end of March, and in doing so lost more than $248 billion in market value in 1 session. $2,000 billion has now evaporated since the peak of this stock. Bank of America removed the stock from its 'US number 1 list', but kept its buy rating in place. Microsoft lost 2.2% to $533.16, while Take-Two Interactive rose 8.3% to $224.64 thanks to strong pre-order figures for GTA VI.
On the bond market the 10 year yield stands at 5.02% and the 30 year yield at 5.36%. Gold is trading at around $4,060, a gain of 0.8%, and silver at around $53, more than 3.3% higher. Bitcoin is barely changed and trades around $73,750. Brent crude stands this morning at around $92.5 per barrel, 1% higher.
|
|
|
|
Our results of the past 12 months
| Month | Result |
| November 2025 | €3,801 |
| December 2025 | €1,204 |
| January 2026 | €151 |
| February 2026 | €3,202 |
| March 2026 | €2,197 |
| April 2026 | -€940 |
| May 2026 | €1,268 |
| June 2026 | €601 |
| July 2026 | €837 |
| August 2026 | €931 |
| September 2026 | €896 |
| October 2026 | €1,506 |
| November 2026 (interim figure 7 November) | -€563 |
| Total up to and including the interim figure for November 2026 | €15,091 |
Past results offer no guarantee for the future.
|
|
AEX and DAX close higher, chips diverge from Wall Street
The AEX closed 0.22% higher on Tuesday at 1,132.4 points, while the DAX gained 0.31% to 26,347 points. Both European indices thus did better than Wall Street, despite the pressure on the American chip sector.
BE Semiconductor Industries (BESI) gained 2.59% to €150.80 and ASML rose 1.28% to €1,361, both against the flow of the weak American chip sector. Deutsche Bank climbed 2% to €33.12. Against that stood a loss of 2.04% for Shell to €43.54, and Volkswagen gave up 2.45% to €68.48.
|
|
Agenda and outlook for today
The American futures point higher across the board this morning. The European futures on the DAX and the AEX also indicate a higher open this morning. In some European countries it is also '11 November' today, known as the armistice of the First World War.
In the US that is called 'Veterans Day', which keeps the American bond market closed while the stock exchanges are open as normal. No important American macro figures are on the agenda.
|
My view on today, patience in a race without a clear winner
This week remains quite volatile. On Tuesday the indices on Wall Street closed negative, although the decline ended up being modest. The too high inflation figures were the main trigger, inflation again came in higher than expected, a moment many traders had been waiting for. I personally did not feel the need to react to it with a position right away, in either direction.
That turned out to be the right choice in hindsight, because this morning the futures are higher again, which means Tuesday's negative session seems to have been wiped away immediately. We are in a phase in which the market switches direction so fast that when you enter you have to be right for at least 24 hours to really keep anything from it, and that is almost impossible at the moment. That will change by itself again, but for now it mainly means I have to exercise patience.
November has so far not brought what I expected of it. We are at a small loss, but I am not going to try to make that good with extra risk, because the total for this year is still nicely in the plus. Today I will calmly look at whether there is something to do, with the Middle East, yields and the technical picture of the indices as the main points of attention.
We are trying to find the right momentum to send our signals to the members by e-mail and SMS. Everyone then decides for themselves which positions are followed and which positions fit their own risk profile. Members must always enter the positions with their own broker themselves.
If you want to follow our updates and positions, become a member via the offer you see in this update.
|
|
The psychology behind this market
After a figure that disappoints the temptation is great to do something right away, purely to regain the feeling of control. Not reacting feels to many investors like standing still, while that is often exactly the wisest choice when a market has not yet chosen a clear direction.
From the coaching role at Guy Systeem Trading this pattern comes up regularly, certainly in a phase in which the price can change direction within a few hours. Waiting for a confirmed signal feels less exciting than jumping in right away, but a loss you try to force back more often ends in a 2nd loss than recovering in a controlled way.
“Discipline is not tested on the day it goes easily, but on the day patience pays off more than a hasty decision.”
|
|
Technical picture DAX
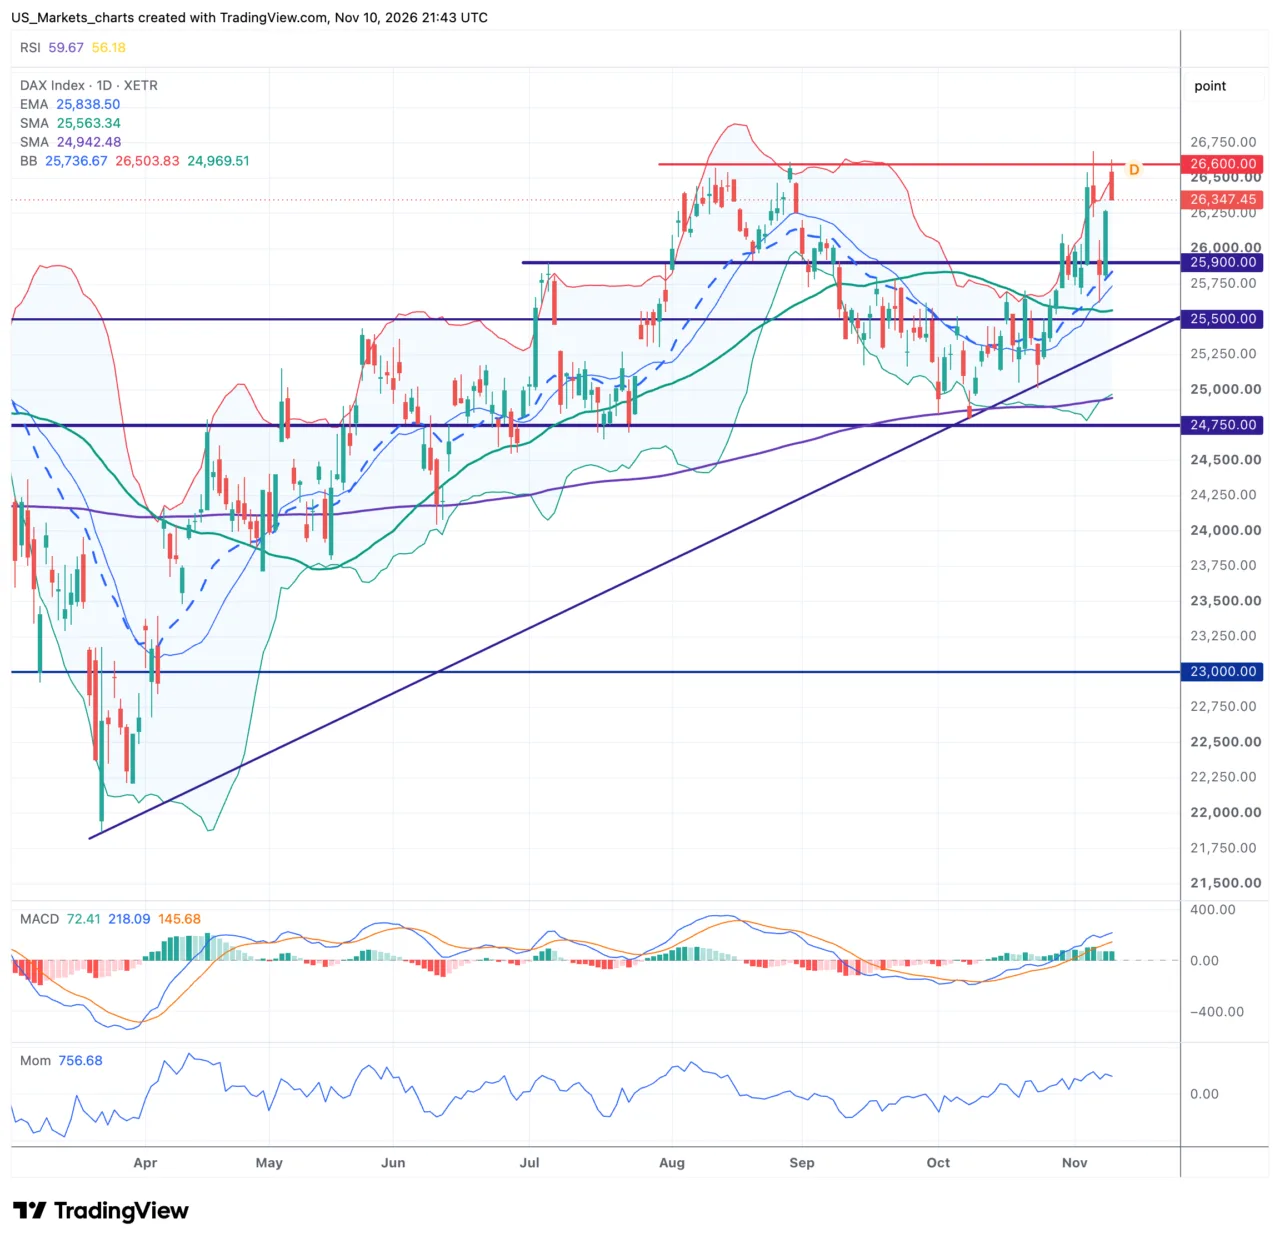
The DAX closed on Tuesday at 26,347 points, after a session between a high of 26,634 and a low that came out exactly at the closing price. The index trades well above the EMA-20, which stands at 25,839, and also above the SMA-50, which stands at 25,563. The SMA-200, which stands at 24,942, lies still a lot lower and confirms the solid trend. The price trades in the upper half of the Bollinger Band, close to the top, a sign that the advance of recent weeks met little headwind.
Click the chart to view it at full size.
Briefly summarized. The SMA-200 stays well below the price, the longer trend is therefore still firmly rising.
The EMA-20 and the SMA-50 both hold as support under the price.
The MACD trades above the signal line and the momentum is positive.
The price trades close to the top of the Bollinger Band, which can lead to a pause in the shorter term.
The DAX remains clearly in a rising trend on the daily chart, with both the EMA-20 and the SMA-50 holding as support under the price. In the shorter term the index is testing the resistance at this week's high around 26,630, a level that has not been broken yet. No clear chart pattern is recognizable, the price mainly climbs steadily within the existing trend.
For the coming sessions a new test of the resistance around 26,630 is likely, with a further step toward 27,000 if that resistance falls. The support holds at the EMA-20 around 25,839, the level that invalidates this picture on a new setback. If the price closes below it, the SMA-50 around 25,563 comes into view as the next safety net.
|
|
Technical picture Dow Jones
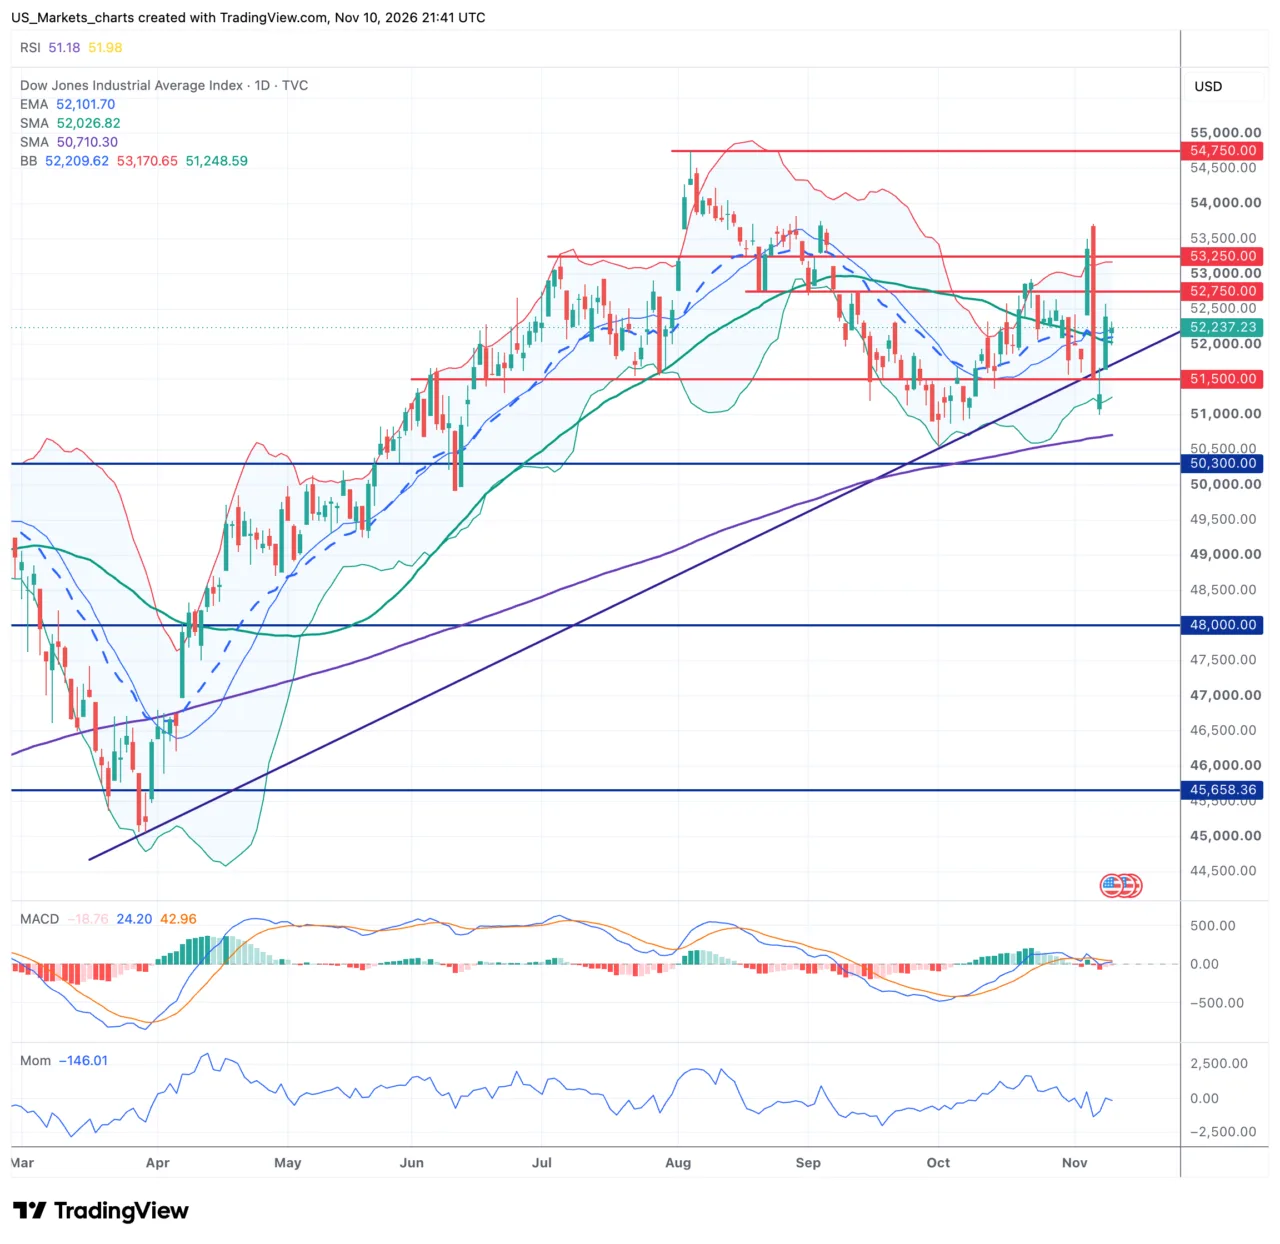
The Dow Jones closed on Tuesday at 52,232 points, after a session between 52,317 and 51,977 points. The index trades just above the EMA-20, which stands at 52,096, and above the SMA-50, which stands at 52,022. The SMA-200, which stands at 50,706, remains a lot lower and keeps the longer trend rising. The price trades about in the middle of the Bollinger Band, after the pause that followed Monday's strong rally.
Click the chart to view it at full size.
Briefly summarized. The SMA-200 well below the price, longer trend still rising.
The EMA-20 and the SMA-50 are just still holding as support.
The price does not get above the resistance at Monday's high around 52,390
The MACD drops below the signal line and the momentum is negative
The Dow Jones remains in a rising trend on the daily chart, with the EMA-20 and the SMA-50 just barely holding as support right under the price. On Tuesday the price slips away again after a test of the resistance at Monday's peak around 52,390. No clear chart pattern is recognizable, the session mainly looks like a pause after the strong swing of a day earlier.
For the coming sessions a new attempt toward the resistance at 52,390 is likely if the support at 52,022 holds. If the price breaks below it, the SMA-200 around 50,706 only comes into view a good deal further down as the next safety net. The support holds as long as the price keeps trading above the zone of 52,000.
|
|
Technical picture Nasdaq 100
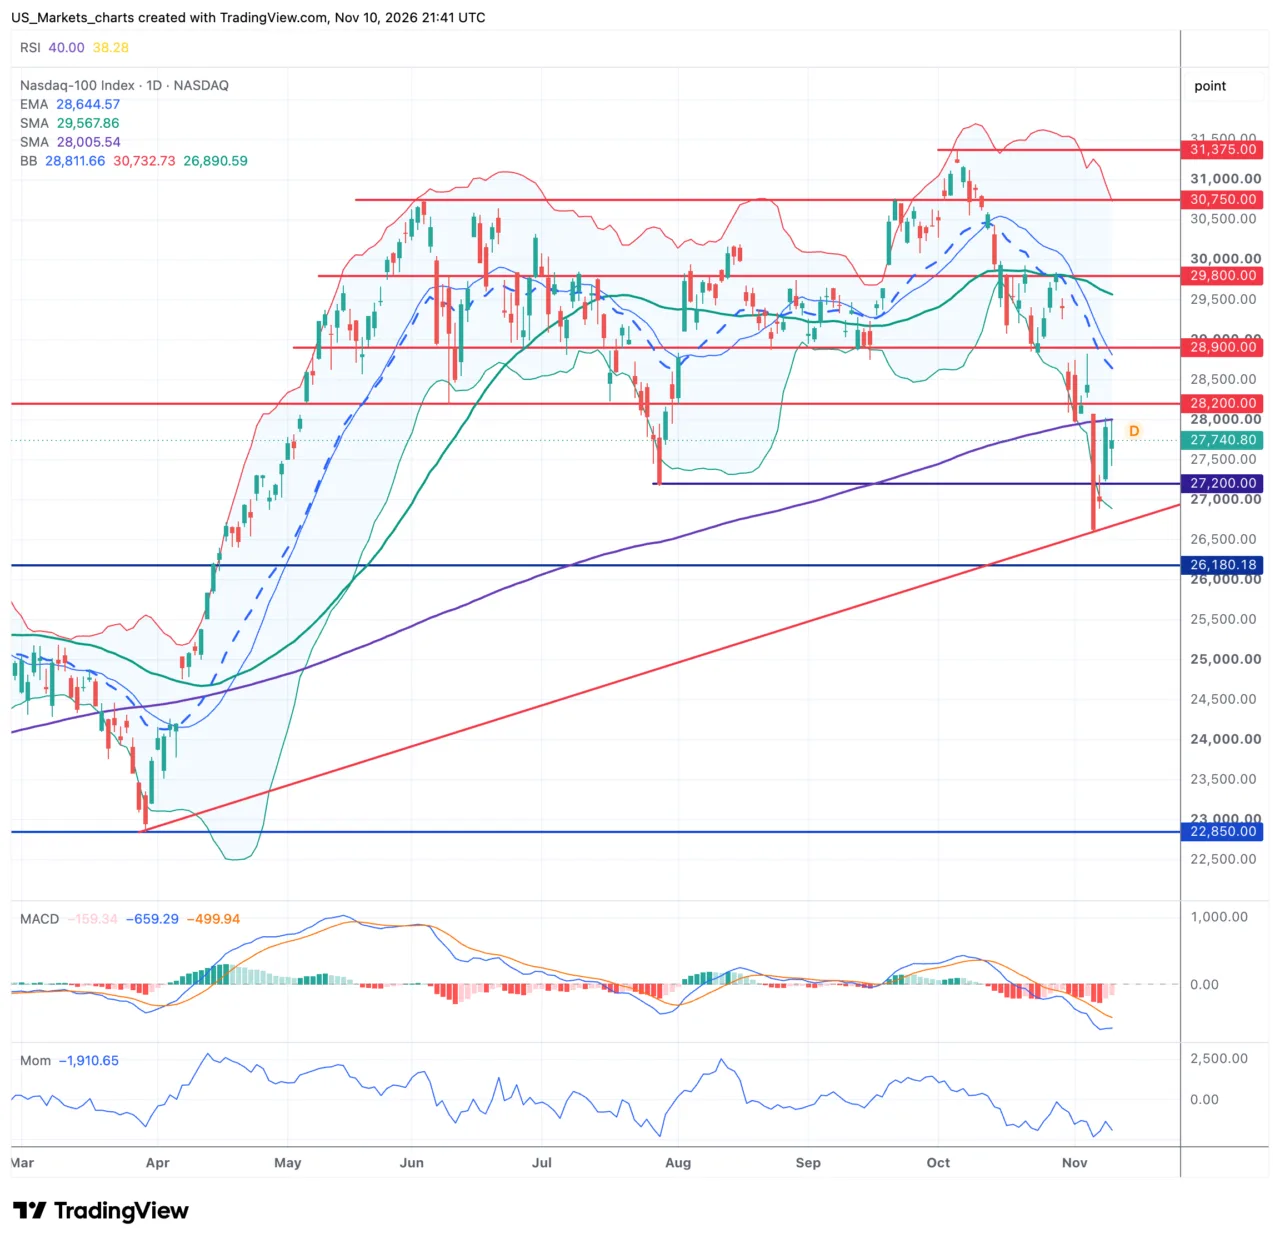
The Nasdaq 100 closed on Tuesday at 27,741 points, after a session between 27,990 and 27,421 points. The index trades just below the SMA-200, which stands at 28,006, the signal of a continuing official correction. The EMA-20, which stands at 28,645, and the SMA-50, which stands at 29,568, also lie well above the price. The price trades in the lower half of the Bollinger Band, which is unusually wide after the volatile sessions.
Click the chart to view it at full size.
Briefly summarized. The support around 26,900, which held 2 times last week, also remains standing on Tuesday.
The RSI of around 40 is nearing the oversold area.
The price does not get above the SMA-200 yet, so the technical correction continues.
The MACD and the momentum remain firmly negative, without a confirmed turning point.
The Nasdaq 100 has been in a technical correction since last week, with the price below the SMA-200. The support holds at 26,900, the zone where the price already turned twice last week and which was also not in danger on Tuesday. No clear chart pattern is recognizable, the index mainly moves within a wide, volatile band.
For the coming sessions a new test of the SMA-200 around 28,006 is likely if the support at 27,200 and 26,900 holds. The price slips away again after a test of that resistance as long as there is no clear breakthrough. A close below 26,900 would weaken the picture further and open the way to a next support zone at 26,180.
|
All information in this update was checked as well as possible, but a lot is nowadays generated with the help of AI, so some small errors may still have slipped in. This update is not investment advice.
Sources. TradingView, Investing.com, Yahoo Finance, MarketWatch, usmarkets.nl.
US Markets Editorial | www.usmarkets.nl
|
|