This page is a translation of the Dutch original.
|
|
US Markets Redactie
Nvidia board considers firing Huang
Morning update Thursday 12 November 2026
|
|
What mainly stands out after Wednesday is the restlessness with which the Nasdaq 100 moved through the session, with a peak of almost 850 points in the green that partly disappeared again towards the close. This morning a new story of the day appears straight away, as Nvidia may be sidelining its CEO Jensen Huang after reports of an affair with a woman that US officials see as a possible Chinese spy. That pushes the future on the Nasdaq 100 lower this morning, while the rest of the market does considerably better and the European indices also look good according to the indication. Yesterday we already opened a few positions on 3 indices, and in the course of today we can look further. Around the tops there is room for a 2nd correction wave of 3 to 5%, especially in Europe, where several indices are trading around their record or have just broken through it. That combination of an uneasy governance issue at nearly the biggest tech company in the world and indices hanging close to their top means today calls for extra attention.
|
|
Investigation into Huang puts Nvidia board in a bind
According to several US media, including The Wall Street Journal, the board of Nvidia is preparing to fire CEO Jensen Huang. The trigger is an external investigation into a relationship between Huang and a woman whom US security services regard as a possible Chinese intelligence source. Earlier this month Huang himself already admitted the extramarital relationship, after which the board had an independent investigation carried out by the law firm Wachtell Lipton.
On Wednesday evening, after the regular close, the stock dropped about 8% on the reports of a possible dismissal, while Nvidia itself closed 2.87% higher at $173.73 during the official session. Remarkably, AMD and Broadcom actually traded higher after hours, which limited the pressure on the broader Nasdaq 100 future, while most other chip names did lose some ground after hours. A spokesperson for Nvidia has not yet confirmed or denied the report about a possible departure of Huang, and investors are now waiting for an official position from the board, which let Wednesday's meeting run on into the evening.
A change at the top of one of the largest listed companies affects more than just the stock itself, certainly for a name so closely intertwined with the financing of the AI sector. Nvidia not only supplies most of the chips behind the data centers of Microsoft, Amazon, Meta and Oracle, with its own investments and long running orders and loans it also supports part of the capital spending of these AI builders, among others at parties such as CoreWeave. If that role disappears or changes tone under a new CEO, it could hit the whole cycle of AI investment, something I already warned about more than once this year. I also said several times that every market at an extreme top meets its 'black sheep', or the 'man with the hammer'.
|
|
Wall Street closes sharply higher, chip sector leads the recovery
Wall Street closed clearly higher on Wednesday. The Dow Jones gained 0.49% to 52,486 points and the S&P 500 rose 1.31% to 7,619 points. The Nasdaq Composite climbed 1.60% to 25,466 points and the Nasdaq 100 gained 2.28% to 28,374 points. The chip index SOX was the standout of the day with a gain of 5.66% to 10,564 points. The smaller Russell 2000 also gained 0.88% to 2,846 points. The fear gauge VIX fell more than 10% to 17.5.
CoreWeave was the big mover with a share price gain of 24.71%, after the company reported revenue of $3.66 billion for the 3rd quarter and raised its revenue outlook for 2026 to $13.0 to $13.3 billion, above analyst expectations. Micron rose 11.89% to $811.30 and SanDisk gained 13.69% to $977.69, both pulled along by broad demand for chips for AI applications. AMD climbed 7.32% to $552.90. Lumentum jumped about 12% higher after Marvell announced a full all share takeover, at an exchange of 4.5 Marvell shares per Lumentum share.
Apple hit a new record intraday above $355 and closed 2.04% higher at $355.63, good for a market value of more than $5.1 trillion. Lululemon stood out the other way with a loss of about 3.8% after disappointing revenue and a lowered outlook.
On the bond market the 10 year yield stands at 4.99% and the 30 year yield at 5.33%. Gold trades at about $3,965, a decline of 0.85%, and silver stands at about $51, 1.75% lower. Bitcoin trades around $73,500, barely changed. Brent crude stands at about $93.2 per barrel this morning, 0.50% higher.
|
|
|
|
Our results of the past 12 months
| Month | Result |
| November 2025 | €3,801 |
| December 2025 | €1,204 |
| January 2026 | €151 |
| February 2026 | €3,202 |
| March 2026 | €2,197 |
| April 2026 | -€940 |
| May 2026 | €1,268 |
| June 2026 | €601 |
| July 2026 | €837 |
| August 2026 | €931 |
| September 2026 | €896 |
| October 2026 | €1,506 |
| November 2026 (interim figure of 7 November) | -€563 |
| Total up to and including the interim figure for November 2026 | €15,091 |
Past results are no guarantee for the future.
|
|
AEX and DAX in record territory, European chip names sharply higher
The AEX closed 1.1% higher on Wednesday at 1,145.1 points, a new record close, while the DAX gained 1.2% to 26,663 points and also closed at a new all time high. Both indices benefited from the same broad rally that also pushed Wall Street in the positive direction.
BE Semiconductor Industries (BESI) rose 5.94% to €159.75 and ASM International even climbed 6.97% to €727.60. ASML gained 3.14% to €1,403.80. In Germany Infineon jumped 6.26% higher to €52.12 and Siemens gained 2% to €277. Shell rose 1.36% to €44.13.
That the European chip names rose at least as hard as their American counterparts underlines how global the optimism about CoreWeave and the broader AI demand was.
|
|
Agenda and outlook for today
The US futures point in different directions this morning. The future on the Dow Jones, the one on the S&P 500 and the one on the Nasdaq 100 are lower, driven by the after hours share price drop of Nvidia. In Europe the future on the DAX points to a higher open. The AEX future we see as practically flat.
Today the weekly jobless claims are on the agenda, with an expectation of 189,000 against 195,000 a week earlier, as are existing home sales for October, expected at 3.8 million against 4.0 million the month before. In addition, Fed Governor Michael Barr, Cleveland Fed President Beth Hammack, San Francisco Fed President Mary Daly and New York Fed President John Williams speak at various moments of the day. According to the calendar, Cisco Systems is scheduled to report quarterly results today.
|
My view on today, alert in a market around the tops
The volatility just keeps going at the moment. On Wednesday the Nasdaq 100 again stood out intraday, with a rise of almost 850 points, but towards the close a good part of that had to be given back again. And then this morning there is straight away a new story of the day, because Nvidia may be sidelining its CEO after the affair with a woman who is seen as a possible Chinese spy. That at least pushes the future on the Nasdaq 100 lower. For the rest of the market it is still fairly mild, and the indices in Europe seem to be doing well according to the indication.
Even though it is hard to make a decision at exactly the right moment, yesterday we opened a few positions during the sharp rise, and that on 3 indices. In the course of the session we may add 2 to 3 more positions. From now on I see opportunities around the tops for the 2nd round of the correction to start, especially for the indices in Europe that trade around their top or even seem to be just above it. That at least gives me a signal for a possible correction of 3 to 5%.
Still, this market remains difficult and challenging, so you can never say with certainty which way it will go. One day it is euphoria at its peak, the next day nobody sees it working anymore. We are of course following the story around Nvidia closely and watching what the other sectors do with it. Do not forget that Nvidia stands behind a great many AI billions, and the company has been called the bank of AI development for some time now. It not only supplies the chips behind most of the data centers of the big players such as Microsoft, Amazon and Meta, with its own orders and investments it also supports part of their capital spending. If that support falls away under a new CEO, CAPEX around AI developments could end up hurting even more.
We are trying to find the right momentum to send our signals to members by email and SMS. Everyone then decides for themselves which positions are followed and which positions fit their own risk profile. Members must always enter the positions with their own broker themselves.
If you want to follow our updates and positions, then become a member via the offer you see in this update.
|
|
The psychology behind this market
As soon as confidence in a company's CEO wavers, investors' attention quickly shifts from the numbers to the question of who is still at the helm. That distrust does not have to be rational to move prices, it is enough that the uncertainty itself becomes tangible.
From the coaching role at Guy Systeem Trading this pattern comes up more often, especially when a familiar story suddenly flips. Anyone who trades purely on distrust often sells just when the uncertainty is greatest, while a check of the underlying numbers and the broader picture is usually a better compass than the first gut feeling.
“Distrust seldom checks the numbers, it would rather doubt the face reading them out.”
|
|
Technical picture Nasdaq 100
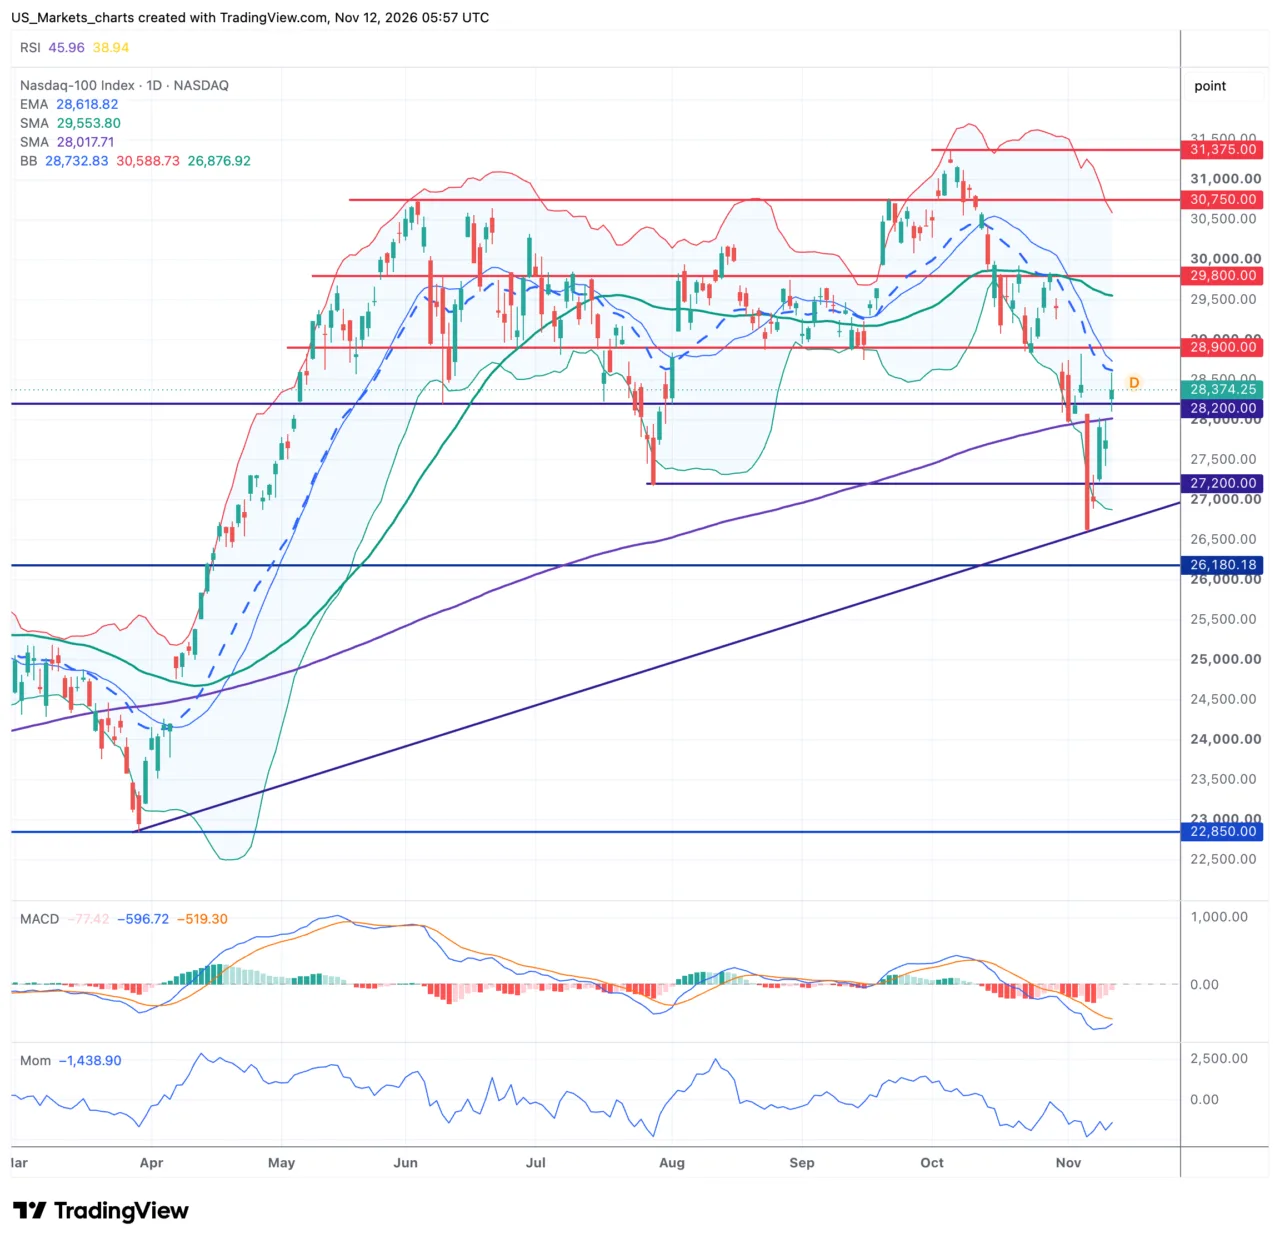
The Nasdaq 100 closed on Wednesday at 28,374 points, a gain of 2.28% after a session in which the index reached above 28,590 points intraday. The price thereby climbs back above the SMA-200, which comes in at 28,018, and leaves the official correction of the past days behind for the time being. The EMA-20, which comes in at 28,619, and the SMA-50, which comes in at 29,554, are still above the price and form overhead supply. The Bollinger Band is unusually wide after the volatile days of the past weeks, with the price in the lower half of that band.
Click on the chart to view it in full size.
In short. The price climbs back above the SMA-200, a first step out of the official correction.
The support at 27,200, which the price has already caught twice, holds again.
The EMA-20 and the SMA-50 are still above the price and remain resistance.
The MACD stays below the signal line, the momentum is slowing a little less quickly.
After last week's sharp drop the Nasdaq 100 climbs back above the SMA-200, with a support zone around 27,200 that already held twice in the past days and so may form the start of a bottom. The price does not yet get above the resistance at 28,900, the zone where a role reversal between support and resistance already took place several times. There is no confirmed chart pattern, the index mainly moves in a broad, volatile band between the support and the resistance.
For the coming sessions a new attempt towards the resistance at 28,900 is the logical expectation as long as the support at 27,200 stays in place, with the zone around 29,800 as the next hurdle above it. If the price drops below the SMA-200 around 28,018 again, that is the level that invalidates this recovery and could put the support at 27,200 to the test again.
|
|
Technical picture S&P 500
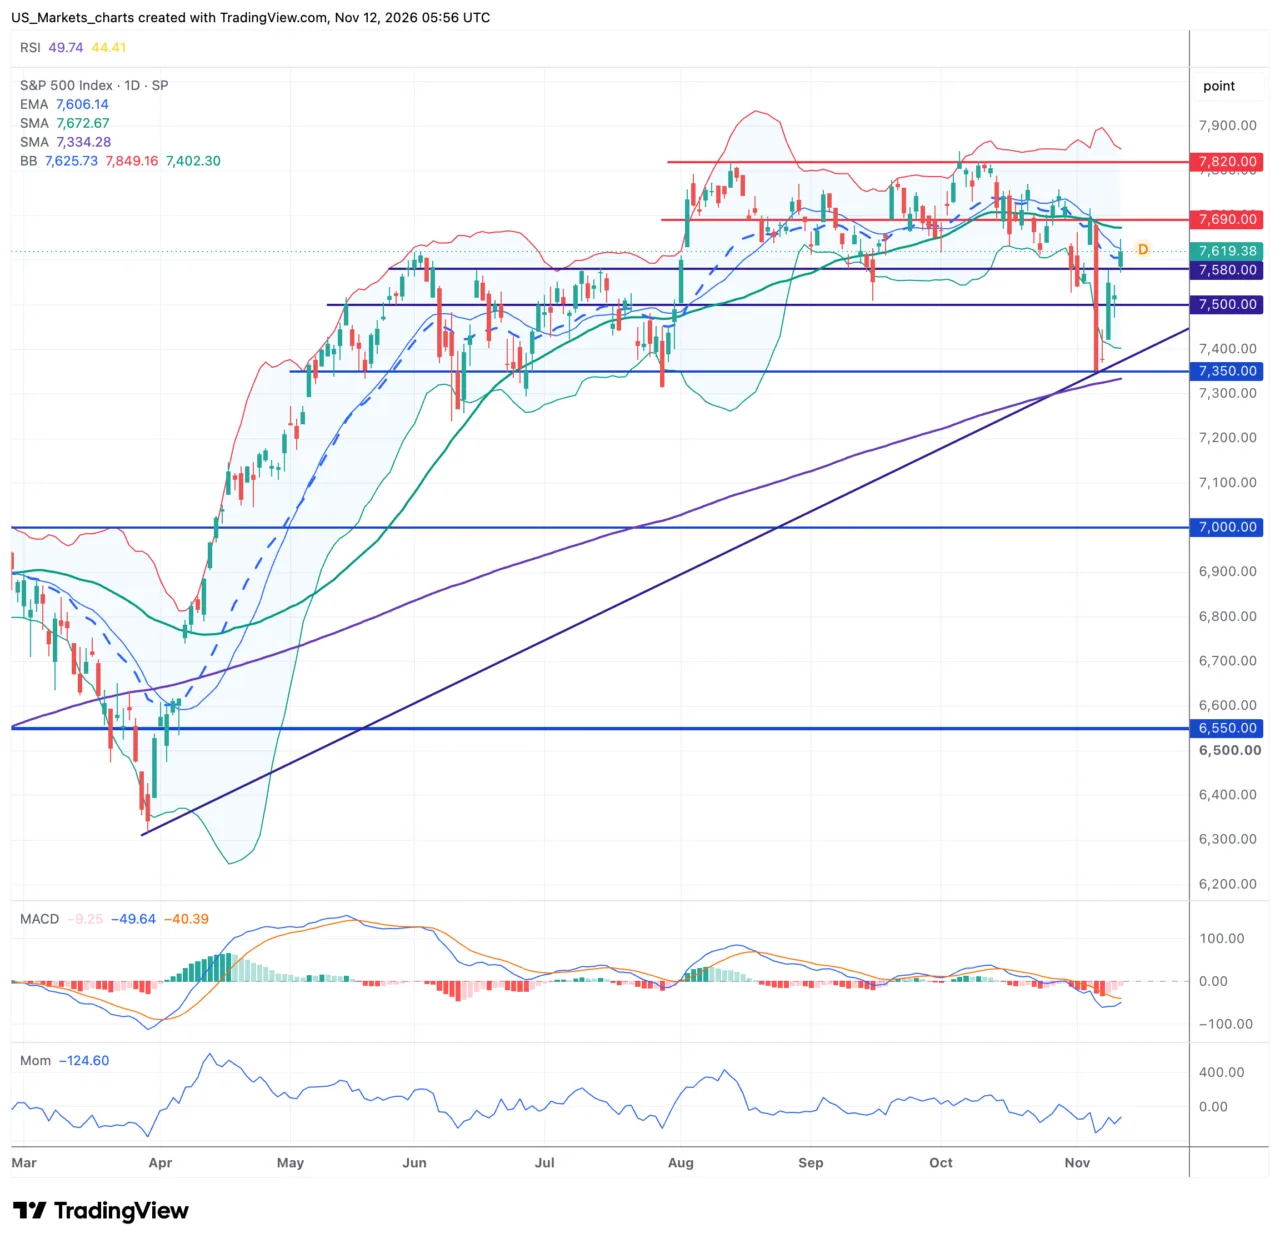
The S&P 500 closed 1.31% higher on Wednesday at 7,619 points, after a session between 7,572 and 7,647 points. The price trades just above the EMA-20, which comes in at 7,606, but stays below the SMA-50, which comes in at 7,673. The SMA-200, which comes in at 7,335, is a good deal lower and keeps the longer trend rising. The price trades roughly on the middle line of the Bollinger Band, after the drop earlier this week.
Click on the chart to view it in full size.
In short. The EMA-20 just holds as support under the price.
The SMA-200 stays well below the price, the longer trend stays rising.
The price does not get above the SMA-50, which remains hanging overhead as resistance.
The MACD trades below the signal line and the momentum is still slightly negative.
The S&P 500 already recovers a good part on Wednesday from the drop earlier this month, with the EMA-20 just holding as support. The price does not yet get above the resistance at 7,690, with the zone around 7,820 as the next hurdle above it. No clear chart pattern can be recognized, the index has been moving in a broad trading range since August.
For the coming sessions a new attempt towards the resistance at 7,690 is the logical expectation as long as the support at 7,580 stays in place. If the price drops below it, the zone around 7,500 comes into view as the next safety net, the level that invalidates this recovery.
|
|
Technical picture AEX
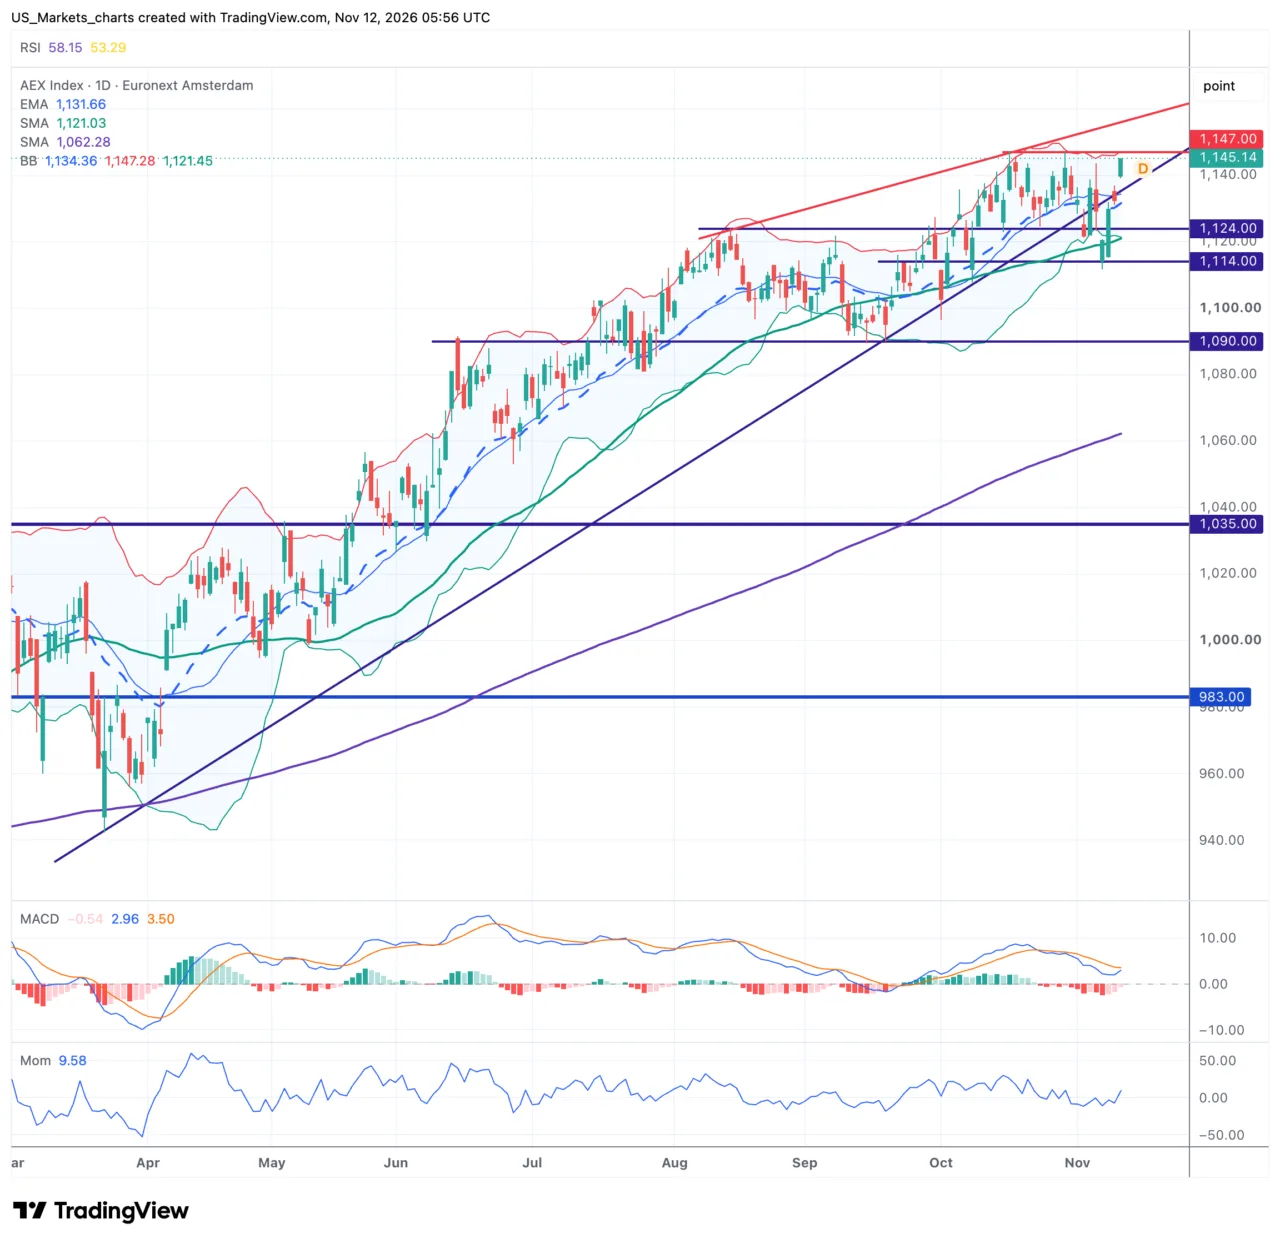
The AEX closed on Wednesday at a new top position of 1,145.1 points, after the index stayed close to the highest level of the day throughout the session. The price trades well above the EMA-20, which comes in at 1,132, and also above the SMA-50, which comes in at 1,121. The SMA-200, which comes in at 1,062, is a good deal lower and underlines the solid longer uptrend. The price moves up against the top of the Bollinger Band, a sign that the climb of recent weeks barely met any headwind.
Click on the chart to view it in full size.
In short. The SMA-200 stays far below the price, longer trend rising.
The EMA-20 holds as support just below the price.
The price at the top of the Bollinger Band could lead to a pause.
The MACD trades just below the signal line, a sign that the upward strength is fading a little
The AEX stays in a clear rising trend on the daily chart, with the EMA-20 holding as support just below the price. In a pullback the support around 1,124 holds, a level the price has already caught several times in recent weeks, with the zone around 1,114 as the next safety net below it. No pronounced chart pattern can be recognized, the index mainly keeps climbing steadily to new tops within the existing trend.
For the coming sessions a new test of the record zone around 1,147 is the logical expectation, as long as the support at 1,124 stays in place. The EMA-20 around 1,131 is the level that invalidates this picture in a new pullback. If the price closes below it, then the 1,124 and the SMA-50 around 1,121 come into view as the next safety net.
|
Disclaimer:
All information in this update was checked as well as possible, but a lot is nowadays generated with the help of AI, so there may still be some mistakes in it. This update is not investment advice.
Sources:
TradingView, Yahoo Finance, MarketWatch, usmarkets.nl.
US Markets Redactie | www.usmarkets.nl
|
|