This page is a translation of the Dutch original.
|
|
US Markets Redactie
Kress takes the helm at Nvidia
Morning update Friday 13 November 2026
|
|
It is Friday, the end of another eventful trading week, and what will stay with us most is the outcome at Nvidia, where CEO Jensen Huang has left after an investigation into his position and chief financial officer Colette Kress takes over for now. I did little myself this week, with 3 short positions on indices that I am keeping for now, while the market moves a lot but hardly gets anywhere. Next week also has a big event on the agenda, because Anthropic is expected to go public on 19 November, with a valuation that has meanwhile dropped from the earlier mentioned $2 trillion to about $1.3 trillion, with an offering that is reportedly already oversubscribed 6 times. What strikes me is that Nvidia lost about as much market value in recent weeks as Anthropic can soon add, as if one story feeds the other. Not even a week ago, on Thursday 5 November, the chip index lost more than 12% in one day, a fall that I already linked to forced selling caused by margin calls. Today feels to me like a kind of final phase of the long AI rally, in which enthusiasm for the sector is increasingly interrupted by shock corrections like these.
|
|
Nvidia confirms Huang's departure, Kress at the helm for now
The board of Nvidia confirmed on Thursday that CEO Jensen Huang is stepping down. The reason was an external investigation into a personal relationship of Huang with a woman whom US security services see as a possible link to Chinese intelligence services. Chief financial officer Colette Kress takes over for now as interim CEO, while Huang himself has reportedly been called to testify before Congress about the matter.
The Nvidia share dropped about 13% intraday at the height of the unrest on Thursday, before winning back part of the loss and closing the session 4.34% lower at $166.19. AMD and Broadcom on the other hand gained 5.86% and 5.54%, as possible beneficiaries of the uncertainty around the leadership of their biggest competitor. A story that very likely gets a sequel in the coming period. As we know, in every bubble a few companies have to be knocked off their throne.
A change at the top of the most important chip company affects the sector more broadly, certainly at a name that is closely intertwined with the financing of the AI sector. Nvidia not only supplies chips to the data centers of Microsoft, Amazon and Meta, it also supports part of their spending with its own orders. Nvidia has more than once been called "the bank of the AI trade".
|
|
Wall Street closes slightly lower, Nasdaq feels Nvidia the most
Wall Street closed slightly lower overall on Thursday. The Dow Jones lost 0.36% to 52,297 points and the S&P 500 fell 0.35% to 7,592 points. The Nasdaq Composite gave up 0.39% to 25,366 points and the Nasdaq 100 lost 0.30% to 28,289 points. The SOX chip index fell 0.54% to 10,507 points, mainly because of the heavy weight of Nvidia in the index, and the smaller Russell 2000 lost 1.66%.
Besides the price drop at Nvidia, memory maker SanDisk stood out with a loss of 4.11% to $937.46, in line with the broader unrest around chip names. AI cloud company Nebius plunged about 17.5% after a disappointing capacity announcement, with part of the delivery to Microsoft reportedly shifting to the 1st half of 2027.
On the bond market the 10 year yield stands at 5.13% and the 30 year yield at 5.46%. Gold trades at about $3,897, 0.52% higher, and silver stands at about $49.97, 0.11% lower. Bitcoin dropped sharply to about $68,201, a loss of 4.45%. Brent oil trades this morning around $96 per barrel.
That the gains at AMD and Broadcom could not lift the SOX chip index shows how much weight Nvidia alone has in that index.
|
|
|
|
Our results of the past 12 months
| Month | Result |
| November 2025 | €3,801 |
| December 2025 | €1,204 |
| January 2026 | €151 |
| February 2026 | €3,202 |
| March 2026 | €2,197 |
| April 2026 | -€940 |
| May 2026 | €1,268 |
| June 2026 | €601 |
| July 2026 | €837 |
| August 2026 | €931 |
| September 2026 | €896 |
| October 2026 | €1,506 |
| November 2026 (interim figure 7 November) | -€563 |
| Total up to and including the interim figure for November 2026 | €15,091 |
Past results offer no guarantee for the future.
|
|
AEX and DAX divided, chip names in the red in Amsterdam
The AEX closed 0.44% lower on Thursday at 1,140.1 points, while the DAX gained 0.41% to 26,772 points. While the German market saw industrial stocks rise, it was mainly the chip related names in Amsterdam that stayed in the red.
ASML lost 1.92% to €1,376.80, BE Semiconductor Industries (Besi) fell 1.06% to €158.05 and ASM International gave up 0.47% to €724.20. Adyen lost 0.75% to €868.00. In Germany Siemens gained 1.70% to €281.70, while Infineon closed practically flat at €52.11. Shell also remained practically unchanged at €44.12.
|
|
Agenda and outlook for today
US futures point mostly lower this morning. The future on the Dow Jones is flat, while those on the S&P 500 and the Nasdaq 100 are both trading lower. In Europe the future on the DAX also points to a lower open. The AEX future also shows a lower open.
The macro agenda is relatively quiet today. Attention mainly stays on the aftermath of Huang's departure at Nvidia and on the run up to the IPO of Anthropic, which is expected next week Thursday on the Nasdaq under the ticker ANT, with a price range of $70 to $78 per share. This afternoon at 14:30 the PPI inflation figures arrive, in other words the producer prices. Several members of the Fed will also speak today.
|
My view on today, carefully on the sidelines
It is Friday again, the end of another eventful week. This was the week of Nvidia, where CEO Jensen Huang was ousted and replaced by chief financial officer Colette Kress. I did little myself this week. We did open a few positions on indices that we want to keep for now, as the market is not really getting anywhere yet. We keep a close eye on everything, and as soon as something changes, the members receive a message right away.
Next week Anthropic will most likely go public. The date is 19 November, so next week Thursday. That could also become a kind of milestone, because people will mainly look at the market value. Where people first assumed $2 trillion in market value, they now estimate about $1.3 trillion. The subscription is apparently already oversubscribed 6 times.
The value of the AI sector remains the most discussed topic, and here and there we see quite a lot of market value evaporate. We just talked about Anthropic, which apparently could add $1 to $1.5 trillion in market value, but Nvidia lost about as much market value in recent weeks. Barely a week ago, on Thursday 5 November, when the chip index lost more than 12%, I already talked about forced selling due to margin calls. Now after the rebound the departure at Nvidia suddenly comes on top, and next week the IPO of Anthropic. To me it feels like a kind of final phase of the long AI rally, and that is why I do not want to take too much risk with individual stocks at the moment.
We are trying to find the right momentum to send our signals by email and text message to the members. Everyone then decides for themselves which positions are followed and which positions fit their own risk profile. Members must always enter the positions with their own broker themselves.
If you want to follow our updates and positions, become a member via the offer you see in this update.
|
|
The psychology behind this market
A story like this week's at Nvidia touches on something that is often underestimated in the psychology of investing, namely how much weight the market can give to the ego of 1 person at the top. As soon as that ego wobbles because of a personal scandal, attention shifts from the numbers to the question of who is still at the helm, even though practically nothing changes in the underlying business results.
From the coaching role at Guy Systeem Trading this pattern comes back more often. Anyone who hangs too much conviction on 1 charismatic CEO often only notices afterwards how vulnerable that position was. Fixed rules and diversification feel less exciting at such a moment, but they do protect you from the blow that someone else's ego can mean for your portfolio.
|
|
Technical view AEX
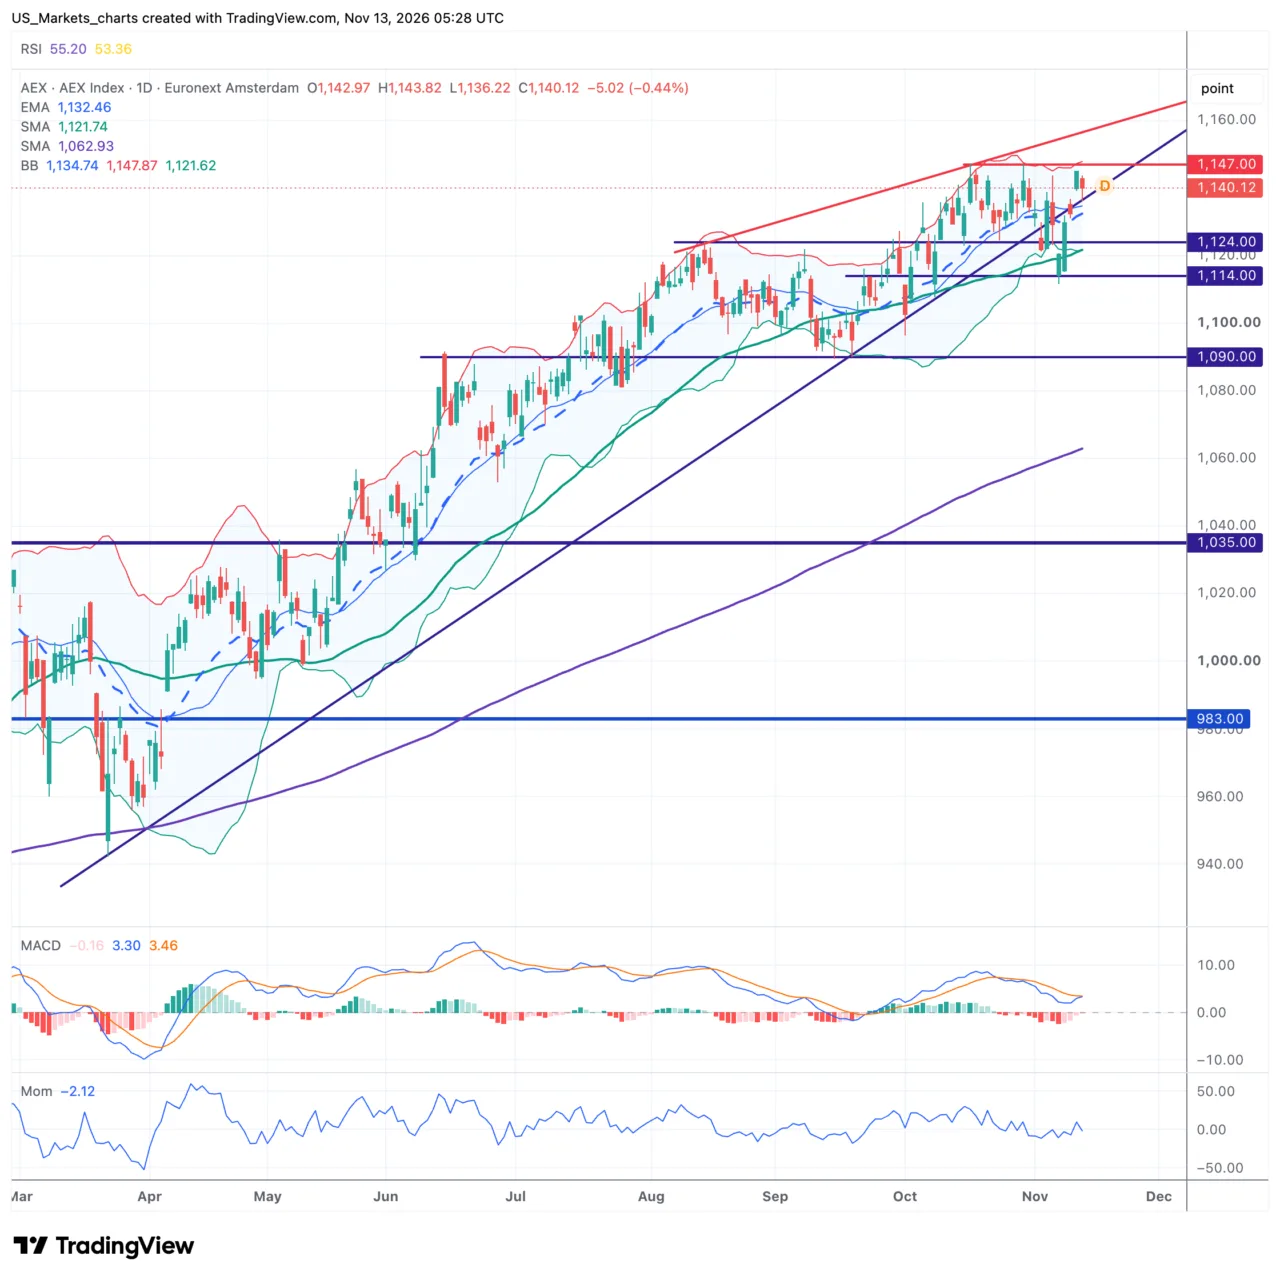
The AEX closed 0.44% lower on Thursday at 1,140.1 points, after testing a new record level earlier this week. The price is still above the EMA-20, which stands at 1,133, and also above the SMA-50, which stands at 1,122. The SMA-200, which stands at 1,063, lies well below and underlines the solid longer trend. The price moves up against the upper side of a relatively narrow Bollinger Band, a sign that the climb of the last weeks hardly met any headwind.
Click on the chart to view it at full size.
In short. The longer trend remains upward, with the SMA-200 below the price.
The EMA-20 holds as support just below the price.
The price does not yet get above the resistance at the record zone.
The MACD stands just below the signal line, a sign that the upward strength is fading.
On the daily chart the AEX stays in a clear rising trend, with a slight pause after the test of the resistance at 1,147, a level that was tested this week. On a pullback the support around 1,124 holds, a level that the price has caught several times in recent weeks, with the zone around 1,114 as the next safety net below. A pronounced chart pattern cannot be recognized, the index mainly climbs steadily within the existing trend.
For the coming sessions a new attempt towards the resistance at 1,147 is the obvious scenario, as long as the support at 1,124 stays intact. The EMA-20 around 1,133 is the level that invalidates this picture on a new pullback, after which the SMA-50 around 1,122 comes into view as the next safety net.
|
|
Technical view Nasdaq 100
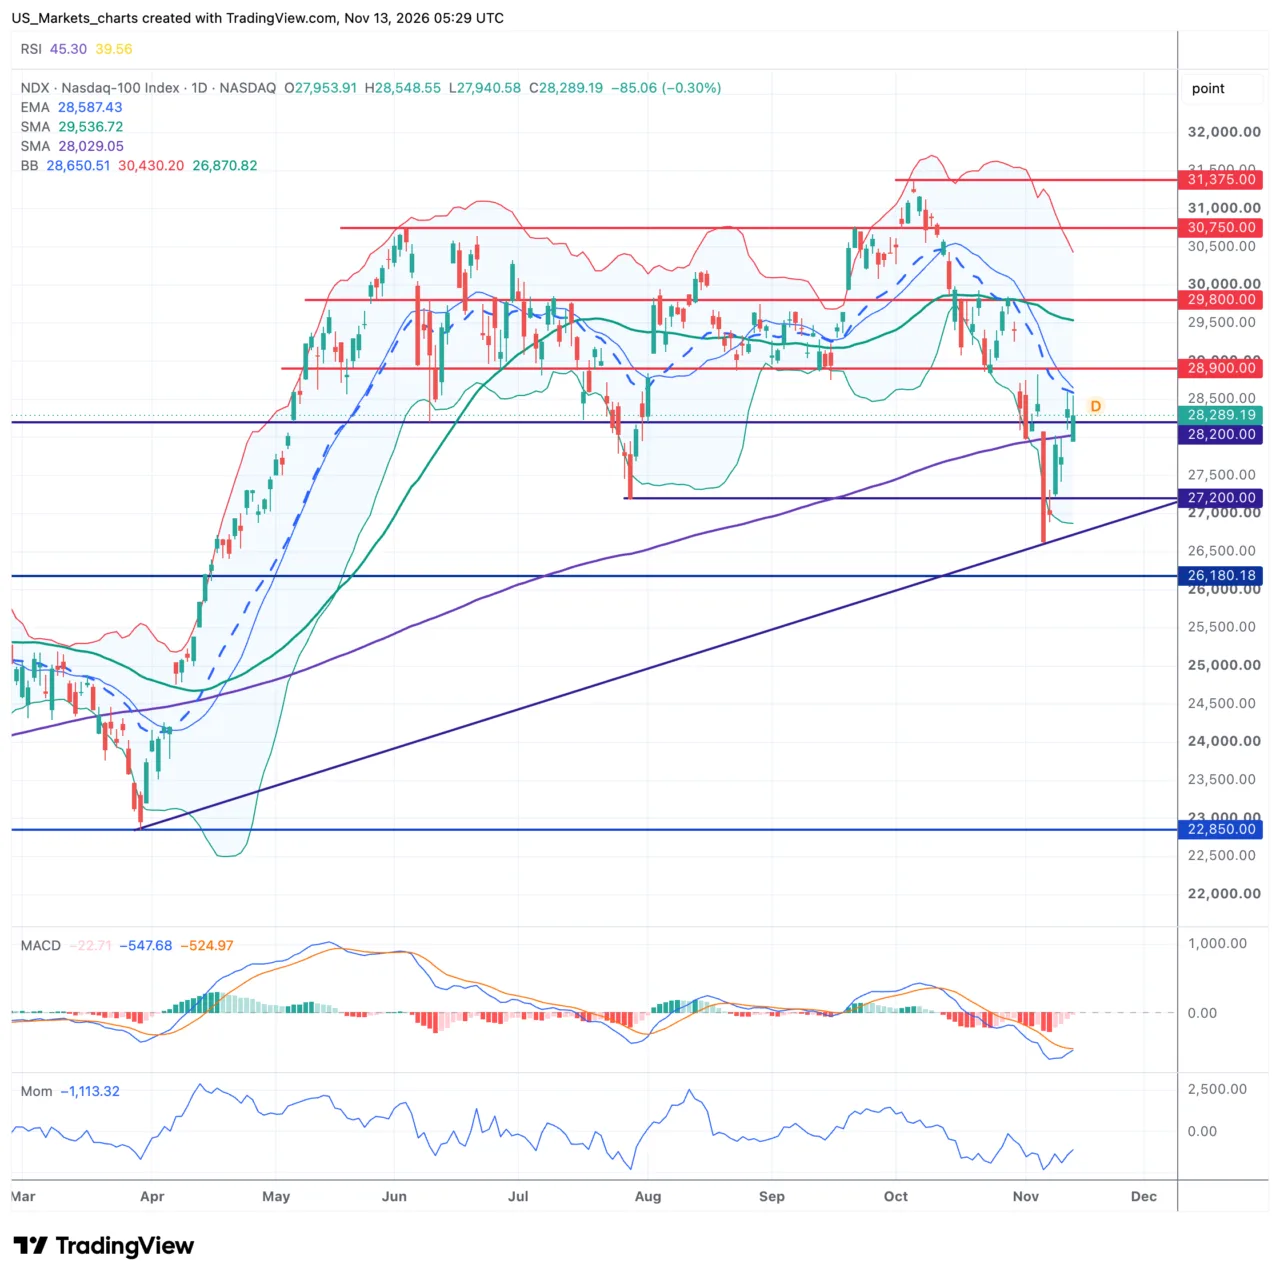
The Nasdaq 100 closed 0.30% lower on Thursday at 28,289 points, after a session between 27,941 and 28,549 points. The price is below the EMA-20, which stands at 28,588, and also below the SMA-50, which stands at 29,537. The price does stay above the SMA-200, which stands at 28,030, and so keeps the longer trend intact. The Bollinger Band is unusually wide after the volatile weeks, with the price still in the lower half of that band.
Click on the chart to view it at full size.
In short. The price holds above the SMA-200, so the longer trend stays intact.
The support around 27,200, which the price has already caught 2 times, remains important.
The EMA-20 and the SMA-50 are still above the price and remain resistance.
The MACD remains below the signal line and momentum is still clearly negative.
The Nasdaq 100 gives back part of the recovery of earlier this week on Thursday, with a support zone around 27,200 that already held 2 times. The price does not yet get above the resistance at 28,900, the zone where a role switch between support and resistance already took place several times. A confirmed chart pattern is not there, the index mainly moves in a wide, volatile band between this support and resistance.
For the coming sessions a new attempt towards the resistance at 28,900 is the obvious scenario as long as the support at 27,200 stays intact. If the price drops below the SMA-200 around 28,030 again, that becomes the level that invalidates the recovery and the support at 27,200 can be put to the test again.
|
|
Technical view S&P 500
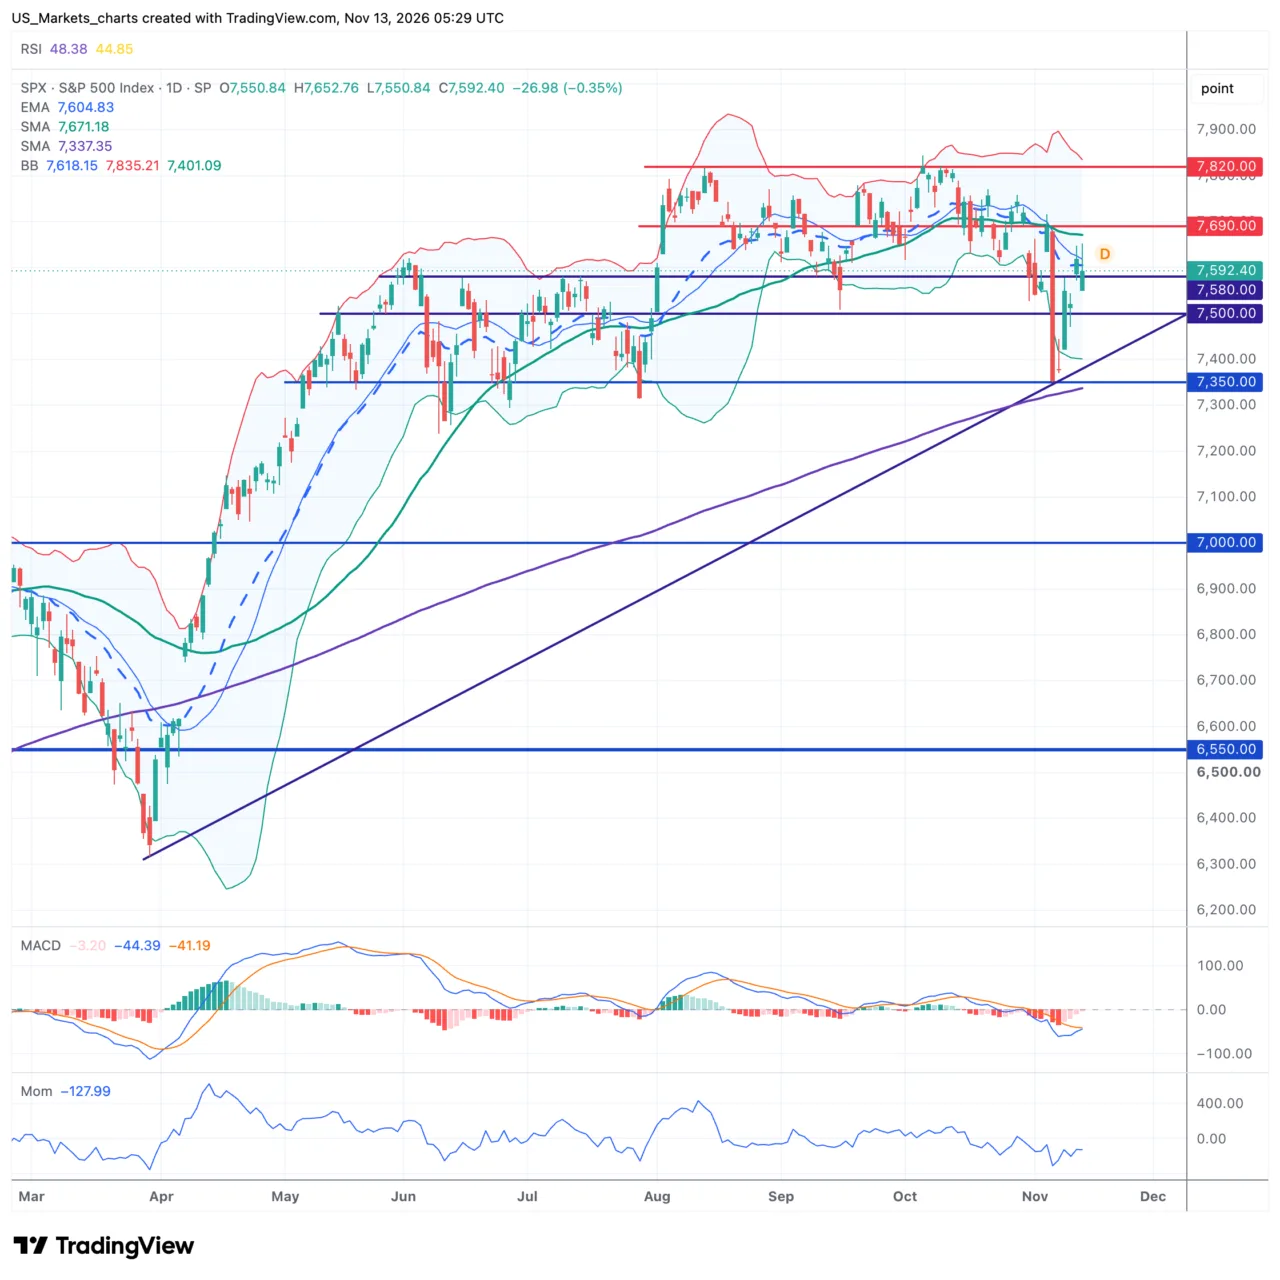
The S&P 500 closed 0.35% lower on Thursday at 7,592 points, after a session between 7,551 and 7,653 points. The price is just below the EMA-20, which stands at 7,605, and also remains below the SMA-50, which stands at 7,672. The SMA-200, which stands at 7,338, lies well below and keeps the longer trend rising. The price trades roughly on the middle line of the Bollinger Band.
Click on the chart to view it at full size.
In short. The SMA-200 stays below the price, the long trend remains rising.
The support around 7,580 holds for now.
The price does not get above the EMA-20, which hangs above the market as resistance.
The MACD stands below the signal line and momentum is slightly negative.
The S&P 500 gives back part of the recent gains on Thursday, with the support around 7,580 still standing. The price does not yet get above the resistance at 7,690, with the zone around 7,820 as the next hurdle above it. A clear chart pattern cannot be recognized, the index has mainly been moving in a wide trading range since August.
For the coming sessions a new attempt towards the resistance at 7,690 is the obvious scenario as long as the support at 7,580 stays intact. If the price drops below it, the zone around 7,500 comes into view as the next safety net, the level that invalidates this picture.
|
Disclaimer:
All information in this update has been checked as well as possible, but a lot is nowadays generated with the help of AI, so some mistakes may still have slipped in. This update is not investment advice.
Sources:
TradingView, Yahoo Finance, MarketWatch, usmarkets.nl.
US Markets Redactie | www.usmarkets.nl
|
|