This page is a translation of the Dutch original.
|
|
US Markets Editorial
Big week ahead for the AI sector and tech indices
Morning update Monday 16 November 2026
|
|
What stayed with me most over the weekend is how divided last week was. On Friday the tech sector took a hefty hit after the opening of Wall Street, but over the whole week the 5 big US indices still ended in the plus, after a series of weaker weeks. Remarkably, the AEX and the DAX barely noticed that last pullback, and the Dow Jones also closed higher on Friday. We were able to profit from the decline on the S&P 500 and the Nasdaq 100 ourselves, by closing positions there with a profit, which brings us back close to the break even point for this month. This week starts in the red, the futures point lower this morning, and attention is quickly shifting to a busy agenda. On Tuesday Nvidia reports earnings, one of the most watched earnings presentations of recent years, and on Thursday the long awaited IPO of Anthropic is on the programme, now valued at somewhere around $1,000 billion to $1,400 billion. There is a good chance that the unrest of recent weeks simply continues this week.
|
|
Earnings week begins, Nvidia and Anthropic in the lead
This week revolves around 2 moments. On Tuesday after the close Nvidia publishes its quarterly results, the first big test for the company since chief financial officer Colette Kress took over from CEO Jensen Huang last week. Investors mainly look at the orders for AI chips and at what the company says about Washington's attempts to restrict Beijing's access to the latest Nvidia chips even further, a dossier that according to press reports could lead to a brief trade friction between the US and China.
On Thursday the IPO of Anthropic follows, after months of delays and adjustments. The expected valuation is now around $1,000 billion to $1,400 billion, quite a bit lower than the $2,000 billion that was mentioned earlier this year. Read also our column (in Dutch) Little room for disappointment at Anthropic.
Also in the background there is still the question of how persistent inflation remains. The latest PPI figure came in at 6.5% year over year, the highest level since November 2022, and the CPI again came in slightly higher than expected.
The combination of persistent inflation and 2 heavy events in the same week explains why yields rose again last week and the market now expects a Fed rate hike in December.
|
|
Wall Street divided, chip names fall hard
Wall Street closed mixed on Friday. The Dow Jones gained 0.10% to 52,347.55 points, while the S&P 500 lost 0.40% to 7,561.67 points. The Nasdaq Composite lost 0.91% to 25,136.27 points and the Nasdaq 100 fell 1.22% to 27,943.74 points. The chip index SOX took the heaviest blow with a loss of 3.43% to 10,146.32 points, and the smaller Russell 2000 also closed 0.31% lower.
Among the chip names Advanced Micro Devices dropped 8.75%, despite the share's strong weekly gain. Cloud company Nebius slid 9.92% and memory maker SanDisk lost 5.59%, in line with doubts about margins in the memory chip market. Nvidia gave up 2% to $162.85, still in the shadow of Huang's departure. Meta Platforms on the other hand gained 2.90%.
In the bond market the 10 year yield stands at 5.14% and the 30 year yield at 5.47%. Gold trades around $3,850, 0.95% lower, and silver stands around $47.4, 3.52% lower. Bitcoin comes in around $64,750. Brent oil trades around $96.3 per barrel after the weekend.
|
|
|
|
Our results of the past 12 months
| Month | Result |
| November 2025 | €3,801 |
| December 2025 | €1,204 |
| January 2026 | €151 |
| February 2026 | €3,202 |
| March 2026 | €2,197 |
| April 2026 | -€940 |
| May 2026 | €1,268 |
| June 2026 | €601 |
| July 2026 | €837 |
| August 2026 | €931 |
| September 2026 | €896 |
| October 2026 | €1,506 |
| November 2026 (interim result 16 November) | -€80 |
| Total up to and including the interim result of November 2026 | €15,574 |
Past results offer no guarantee for the future.
|
|
AEX and DAX hold firm, chip names lower
The AEX closed 0.07% higher on Friday at 1,141 points, while the DAX ended 0.08% lower at 26,750 points. Both indices thereby largely held on to their recent strength, in sharp contrast with Wall Street.
ASML lost 2.76% to €1,338.80, BE Semiconductor Industries (Besi) fell 2.50% to €154.10 and ASM International gave up 4.09% to €694.60. In Germany Infineon lost 4.29% to €49.88. Shell, on the other hand, gained 1.47% to €44.77.
|
|
Agenda and outlook today
The US futures point lower this morning for the Dow Jones, the S&P 500 and the Nasdaq 100 alike. In Europe the future on the DAX points to a slightly higher open. The AEX future also indicates a slightly higher open.
The macro agenda is otherwise relatively quiet today, with mainly the housing market index worth mentioning. Attention this week goes mostly to the quarterly results of Nvidia on Tuesday after the close and to the IPO of Anthropic on Thursday.
|
My view on today, a week with 2 big moments
Last Friday a fairly hefty decline did get going in the technology sectors after the opening of Wall Street, but on balance it was still a positive week, after a few consecutive weak weeks. Again it was notable that mainly the tech sector had that problem, because the DAX and the AEX did not follow that path, and the Dow Jones also managed to close positive on Friday.
The S&P 500 did lose, and we were able to use that decline to close our positions on both the S&P 500 and the Nasdaq 100 with a nice profit. That brings us back close to the break even point for this month after the weak start of November. From this week we again have complete freedom to patiently find out which positions we can still take towards the end of the month. The week starts negatively in any case, the futures on Wall Street are lower this morning.
On Thursday the IPO of Anthropic arrives, and in the run up to it I am curious how the markets will behave. I am at least as curious about what happens once that listing is there. On Tuesday Nvidia also reports earnings, a moment the whole AI and chip sector is watching. There has been no shortage of volatility in recent weeks, and I see no reason why that would change soon.
It is precisely that unrest that usually gives us the opportunities to carry this otherwise excellent market year further. So stay sharp this week.
We are trying to find the right momentum to send our signals to the members by email and text message. Everyone then decides for themselves which positions are followed and which positions fit their own risk profile. Members must always enter the positions with their own broker themselves.
If you want to follow our updates and positions, then become a member via the offer you see in this update.
|
|
The psychology behind this market
A week with 2 announced events, such as the results of Nvidia and the IPO of Anthropic, exposes an interesting trap in the psychology of investing. As soon as the date of an event is fixed, the urge grows to form an opinion about it right now and to aim everything entirely at it, while the outcome remains completely uncertain.
That impatience is a familiar pattern. It wants the answer before the question has been properly asked, and a waiting period quickly feels like lost time. From the coaching role at Guy Systeem Trading this remains a recurring point of attention. Anyone who anticipates a figure or a listing takes unnecessary risk at a moment when patience actually pays off.
“Impatience wants to know the result of Tuesday and Thursday right now, and therefore prefers to buy on a gamble rather than on a plan.”
|
|
Technical view AEX
The AEX closed 0.07% higher on Friday at 1,141 points, and thereby remains within a firmly rising channel that has been intact since the spring. The price trades above the EMA-20, which comes in at 1,134, and also above the SMA-50, which comes in at 1,123. The SMA-200, which comes in at 1,064, lies a good distance lower and underlines the strength of the longer trend. The Bollinger Band is relatively narrow, a sign that after the quiet climb of recent weeks a larger move may follow again. The RSI trades just above the neutral zone, the MACD trades marginally above the signal line and momentum is slightly positive, a cautiously confirming picture for the trend.
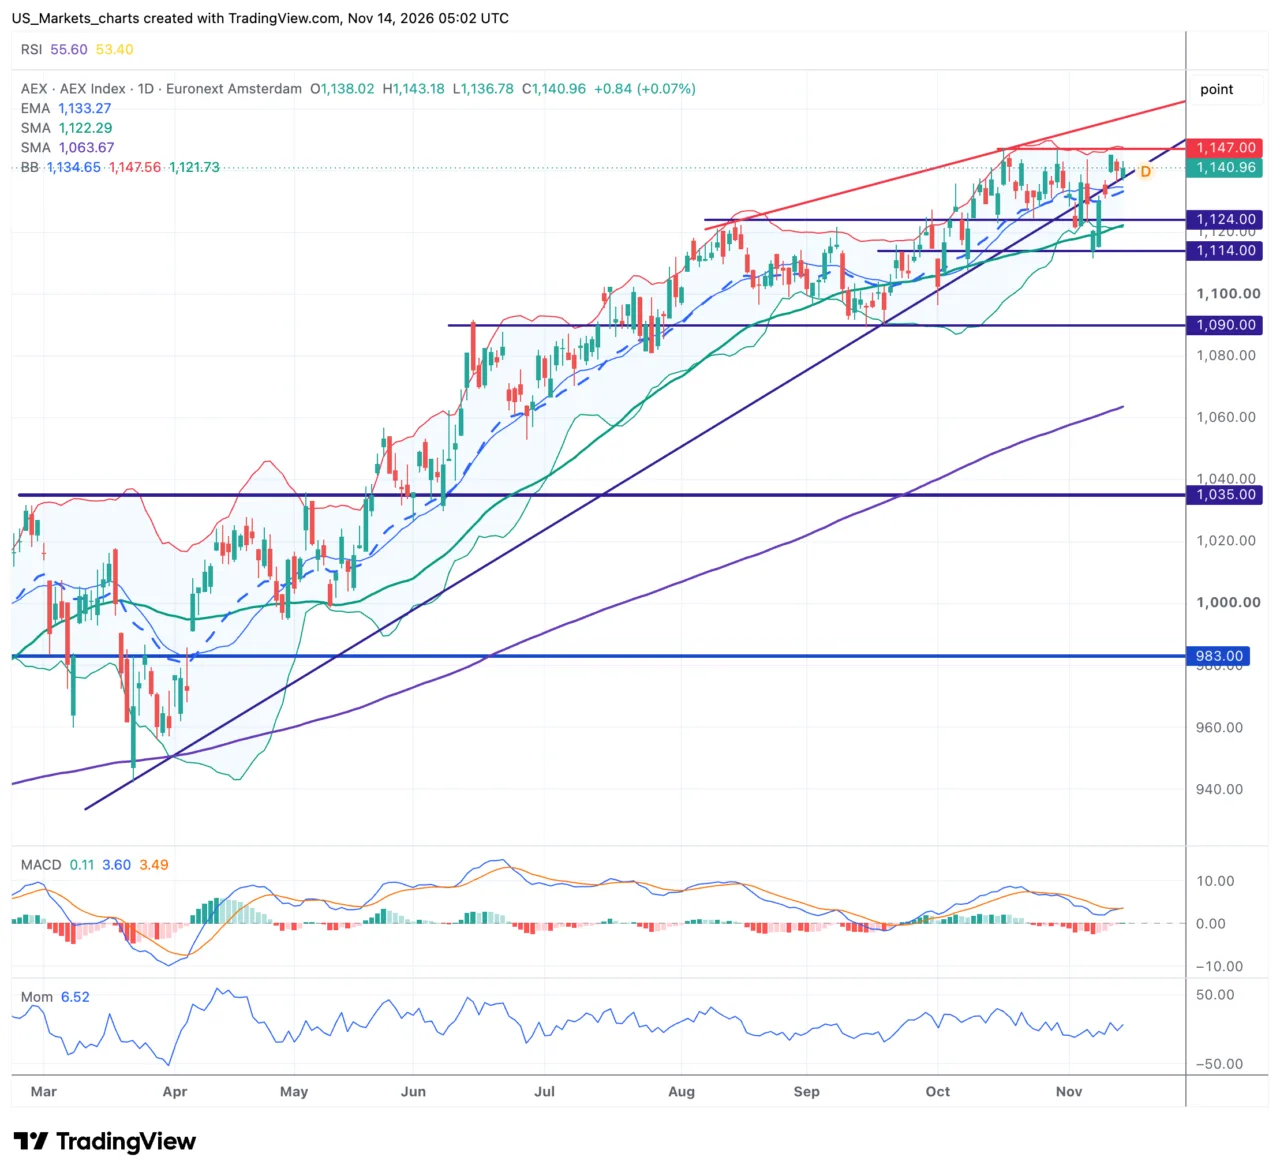
Click on the chart to view it at full size.
Summary in brief.
The SMA-200 lies far below the price, the longer trend remains clearly rising.
The EMA-20 still holds as support just below the price.
The price still does not get durably above the resistance at 1,147.
The narrow Bollinger Band is preparing for a larger move.
On the daily chart the AEX remains in a clear rising trend, with higher tops and higher bottoms since the spring. The price still does not get above the resistance at 1,147, a level that has been tested several times in recent weeks. In a pullback the support around 1,124 holds, with the zone around 1,114 as the next safety net below. A pronounced reversal pattern cannot be recognised, the index mainly climbs steadily within the existing channel.
For the coming sessions a new attempt towards the resistance at 1,147 is the obvious scenario, as long as the support at 1,124 stays intact. After that the support at 1,114 could be put to the test.
|
|
Technical view DAX
The DAX closed Friday almost flat, 0.08% lower at 26,750 points, after earlier in the week breaking out of the sideways band in which the index had been caught since August. The price trades well above the EMA-20, which comes in at 26,070, above the SMA-50, which comes in at 25,610, and also well above the SMA-200, which comes in at 24,973. The Bollinger Band has widened considerably since the breakout, in line with the increased price volatility. The RSI climbs firmly and approaches the overbought zone, the MACD trades well above the signal line and momentum is clearly positive, a strongly confirming picture.
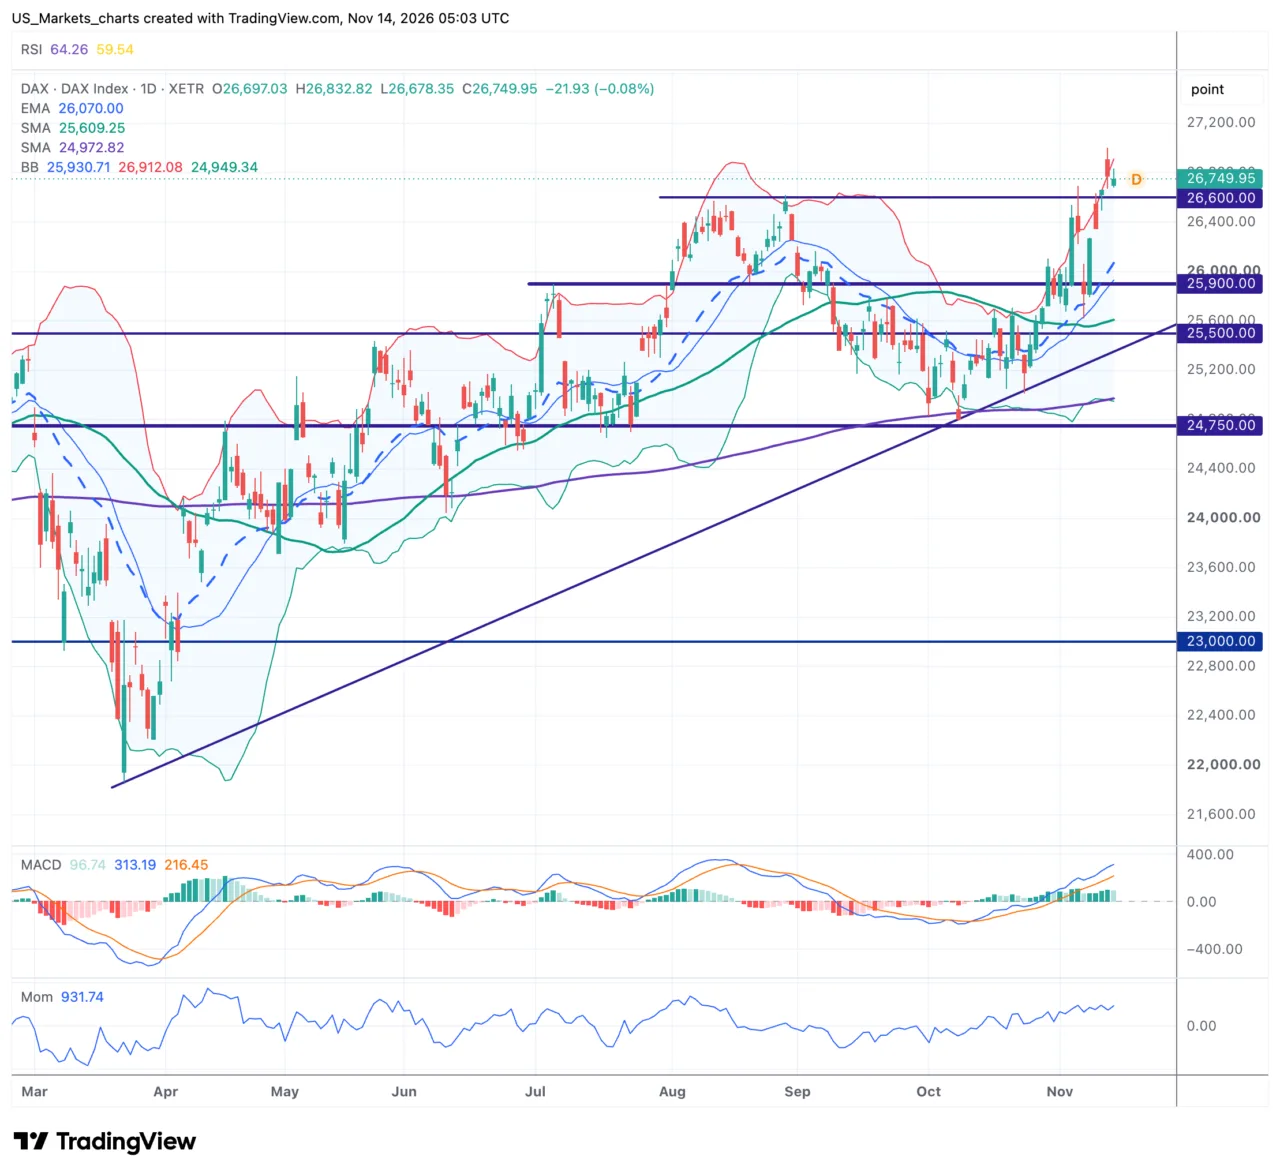
Click on the chart to view it at full size.
Summary in brief.
The breakout above the long sideways band is confirmed.
The old resistance at 26,600 now acts as support after the role reversal.
There is no clear resistance above the current price yet.
The wide Bollinger Band points to heightened unrest, a correction could be sizeable.
The DAX made a sizeable breakout this month above the zone in which the index moved sideways from August to October. We see a rebound from the support around 26,600, the level that previously acted as resistance and has now taken over the role of support. Below that the support around 25,900 holds as a 2nd safety net. Above the current price no meaningful resistance is visible yet, which fits a breakout into new price territory.
For the coming sessions a continuation of the upward move is the obvious scenario, as long as the price stays above the support at 26,600. If the index falls below that, that is the level that invalidates this breakout, after which the support at 25,900 comes into view as the next safety net.
|
|
Technical view Nasdaq 100
The Nasdaq 100 closed 1.22% lower on Friday at 27,944 points, after a session between 27,610 and 28,296 points. The price trades below the EMA-20, which comes in at 28,527, well below the SMA-50, which comes in at 29,506, and on Friday also traded just below the SMA-200 for the first time in a while, which comes in at 28,040. The SMA-50 still lies above the SMA-200, so there is no death cross yet. The Bollinger Band lies unusually wide after the volatile weeks. The RSI stays below the neutral zone, the MACD trades below the signal line and momentum is still clearly negative.
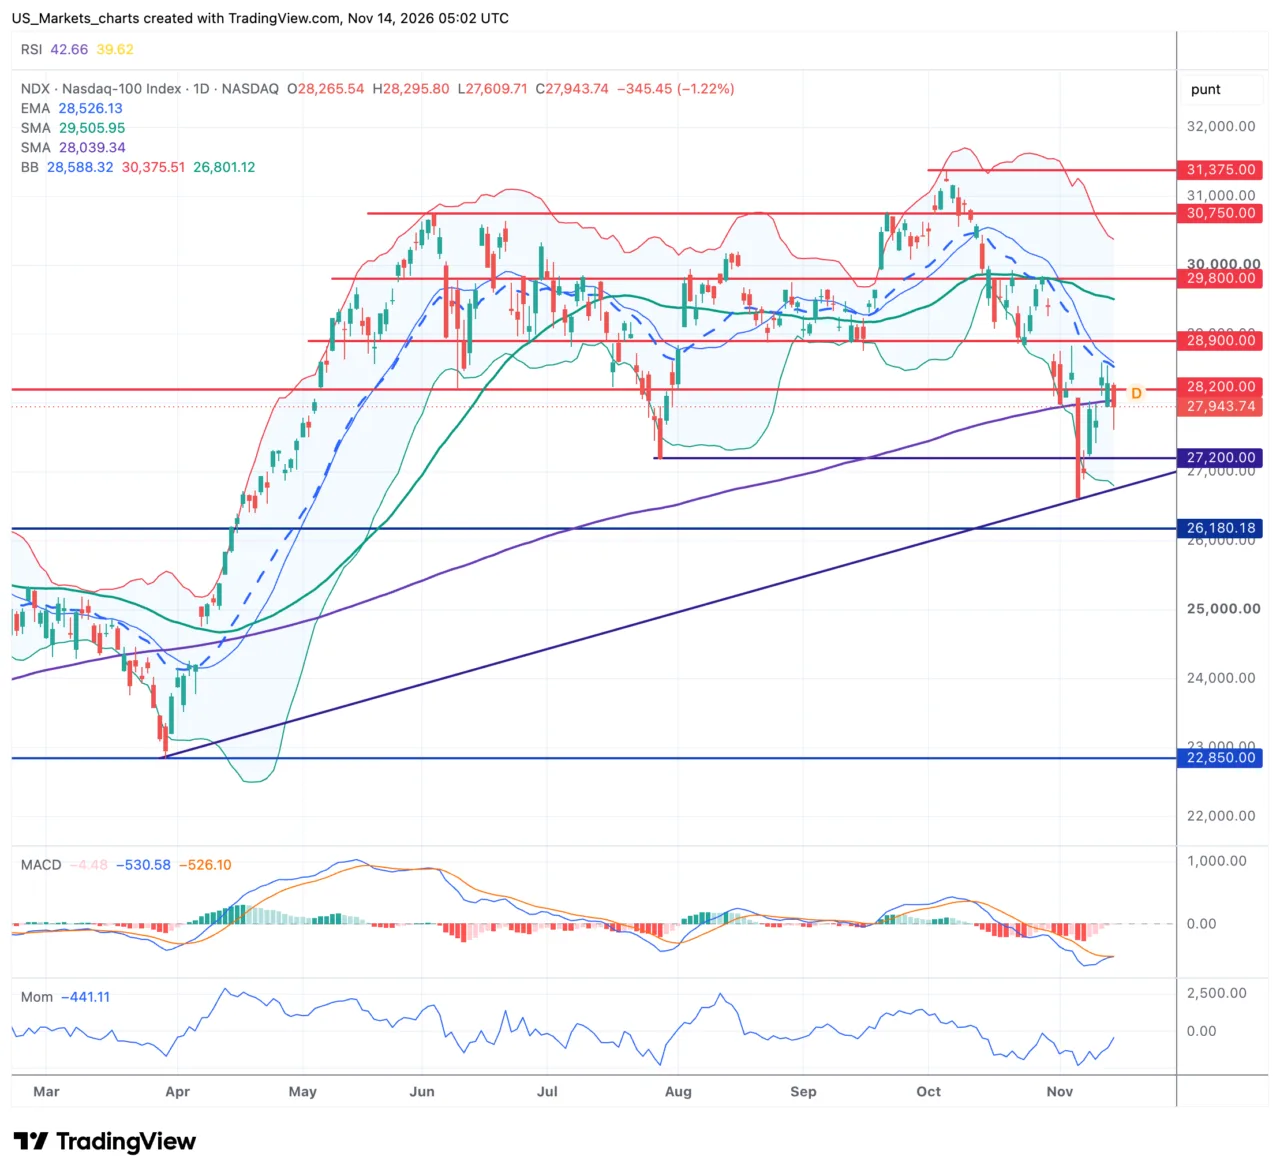
Click on the chart to view it at full size.
Summary in brief.
The SMA-50 still lies above the SMA-200, so the longer trend remains intact.
The support around 27,200 has caught the price several times already.
The price drops just below the SMA-200, a warning signal for the short term.
The wide Bollinger Band points to persistently high price volatility.
The Nasdaq 100 sinks away again after a test of the resistance at 28,900, with the zone around 29,800 as the next hurdle above. The support around 27,200 still just holds for now. A confirmed reversal pattern is not there yet, the index has been moving for several weeks in a wide, volatile trading range between support and resistance.
For the coming sessions the support at 27,200 is the level to watch. If it holds, a new attempt towards 28,900 is the obvious scenario.
|
Disclaimer:
All information in this update was checked as well as possible, but much is nowadays generated with the help of AI, so some small mistakes may still have crept in. This update is not investment advice.
Sources. TradingView, Investing.com, Yahoo Finance, MarketWatch, usmarkets.nl.
US Markets Editorial | www.usmarkets.nl
|
|