This page is a translation of the Dutch original.
|
|
US Markets Editorial
Nvidia tests tonight, chips under pressure
Morning update Tuesday 17 November 2026
|
|
What strikes me most at the start of this week is how quickly the calm disappeared again. It doesn't really surprise me that volatility persists, and I don't expect a breather for the rest of this week either (in either the positive or the negative direction). Tonight after the US close the results of Nvidia come in, and above all what the company says alongside them can set the tone for the rest of the week. To me, Nvidia is slowly becoming a kind of doubtful case in this AI rally, and now and then I think of the momentum around Enron, which collapsed in 2001, and Lehman Brothers in 2008, although I absolutely don't mean to say that Nvidia will follow the same path. For a while now I have been asking who is actually going to pay for all of this, and that question now seems to be on the minds of more investors. On Thursday the IPO of Anthropic comes on top of that, at a moment when a debut could hardly have come at a worse time if the correction continues. There is certainly no shortage of volatility, and that also offers me opportunities to get through this stock market year well. Big setbacks stay away because we approach the markets calmly to limit the risks. | Nvidia and Anthropic put a loaded week on edge
After today's US close Nvidia publishes its quarterly results, which will be the first big test for the company under acting chief Colette Kress, who took over the role after Jensen Huang had to step down last week. Investors are mainly watching the orders for AI chips and what management says about a possible permanent successor.
On Thursday the long awaited IPO of Anthropic follows. Pricing is planned for tomorrow, between $70 and $78 per share, with a valuation that at the top of that range could rise to around $1.4 trillion. Via the following link you can follow the value live via the value indication Anthropic.
In the background the US dollar also plays a role. It gained ground in recent days, mainly because the market is now seriously factoring in a new rate hike at the Fed meeting of 9 December, in what was previously expected to be a pause.
The combination of 2 uncertain events in the same week largely explains why the unrest of recent days continues. For the chip sector, the persistent doubt about the pace of AI investment comes on top of the leadership change at Nvidia.
|
|
Wall Street sharply lower, chip names crash through the floor
Wall Street closed clearly lower on Monday. The Dow Jones lost 1.41% to 51,608 points, while the S&P 500 gave up 1.92% to 7,417 points. The Nasdaq Composite fell 2.49% to 24,510 points and the Nasdaq 100 lost 2.67% to 27,197 points. The chip index SOX again took the hardest blow with a loss of 5.28% to 9,611 points, and the smaller Russell 2000 also closed 1.70% lower.
Among the chip names Micron gave up 7.62% and Advanced Micro Devices fell 5.58%. SanDisk lost 8.58%, the heaviest decliner of the bunch. Investor Stanley Druckenmiller turned out to have sold his stake in both AMD and SanDisk in the 3rd quarter, as well as his entire position in Alphabet, which itself lost 4.07% to $283.72. He bought positions in SpaceX and Palantir instead. Nvidia fell 4.12% to $156.14, ahead of tonight's results.
On the bond market the 10 year yield is at 5.14% and the 30 year yield at 5.48%. Gold is at $3,852, 0.87% lower, and silver is at $46.86, 4.61% lower. Bitcoin is trading almost flat at around $64,500. Brent oil is trading this morning around $91.84 per barrel, 0.65% lower.
That it was mainly the chip sensitive names that took the biggest hits, while the broader market limited its losses somewhat, points to persistent doubt within one specific part of the market.
|
|
|
|
Our results of the past months
| Month | Result |
| November 2025 | €3,801 |
| December 2025 | €1,204 |
| January 2026 | €151 |
| February 2026 | €3,202 |
| March 2026 | €2,197 |
| April 2026 | -€940 |
| May 2026 | €1,268 |
| June 2026 | €601 |
| July 2026 | €837 |
| August 2026 | €931 |
| September 2026 | €896 |
| October 2026 | €1,506 |
| November 2026 (interim figure 16 November) | -€80 |
| Total up to and including the November 2026 interim figure | €15,574 |
Results achieved in the past offer no guarantee for the future.
|
|
AEX holds up better than DAX, chip names under pressure
The AEX closed 0.60% lower on Monday at 1,134.1 points, while the DAX gave up 0.57% to 26,599 points, after earlier in the day still touching a new peak. ASML lost 2.41% to €1,306.80, BE Semiconductor Industries (Besi) fell 2.14% to €150.80 and ASM International gave up 3.57% to €669.80. Shell held up much better with a loss of 0.40% to €44.59.
The fall at ASML, Besi and ASM International runs straight through from the US chip sector via the supply chain. That the AEX and the DAX were nevertheless hit less hard than the Nasdaq 100 and the SOX fits a session in which the unrest was mostly limited to US technology names.
|
|
Agenda and outlook today
US futures point lower this morning for the Dow Jones and almost flat for the S&P 500 and the Nasdaq 100. In Europe the futures point lower for the DAX and the AEX future.
The macro agenda is otherwise relatively quiet today. Nvidia publishes its quarterly results after the close, and tomorrow the pricing of the IPO of Anthropic is planned, ahead of the 1st trading day on Thursday.
|
My view on today: a week with 2 big moments
The start of this week was anything but quiet, and we immediately notice that again in the volatility. In my view there is no time for calm this week either, because tonight after hours the results of Nvidia come in, and above all what is said alongside them counts. To me Nvidia is slowly becoming a kind of first big doubtful case of this AI rally. Now and then I have to think of the momentum around Enron, which collapsed in 2001, and Lehman Brothers in 2008, although I absolutely don't mean to say that Nvidia will follow the same path, but it is a matter that is starting to smell quite bad. Who will ultimately pay for all of this has been on my mind for a while, and that question now lives with more and more investors.
As if that weren't enough, the IPO of Anthropic also arrives on Thursday, and that doesn't seem like a handy moment to me if the correction continues. I'm curious how the markets behave in the run up to it, and at least as curious about what happens once the listing is there.
What I also see coming is that after a new solid decline a rally of a few % can easily get going again. A lot depends on Nvidia tonight and on the IPO of Anthropic this week, and for both I now see it as a kind of 50/50 scenario. That is why we are not taking much risk for the time being.
So there has been no shortage of volatility in recent weeks, and I see no reason at all why that would change soon. That usually also gives us the opportunities to carry this so far good stock market year further.
We try to find the right momentum to send our signals to members via email and SMS. Everyone then decides for themselves which positions are followed and which positions fit their own risk profile. Members must always enter the positions with their own broker themselves.
If you want to follow our updates and positions, become a member via the offer you see in this update.
|
|
The psychology behind this market
A week with 2 announced events, such as the results of Nvidia and the IPO of Anthropic, exposes a familiar mechanism in investor psychology. As soon as the outcome of such an event is still completely open, many investors grow more inclined to be more cautious than the facts at that moment actually justify.
This mechanism is known as loss aversion. For most people a possible loss weighs heavier than an equally large gain, which is why waiting on an evening like this often feels wiser than taking a new position.
From the coaching role at Guy Systeem Trading this remains a recurring point of attention. Not every uncertainty calls for a new position, sometimes patiently waiting until the outcome is known is the better choice.
“Loss aversion never counts a missed gain as heavily as a loss suffered, and that is why waiting on an evening like this often feels wiser than it really is.”
|
|
Technical view DAX
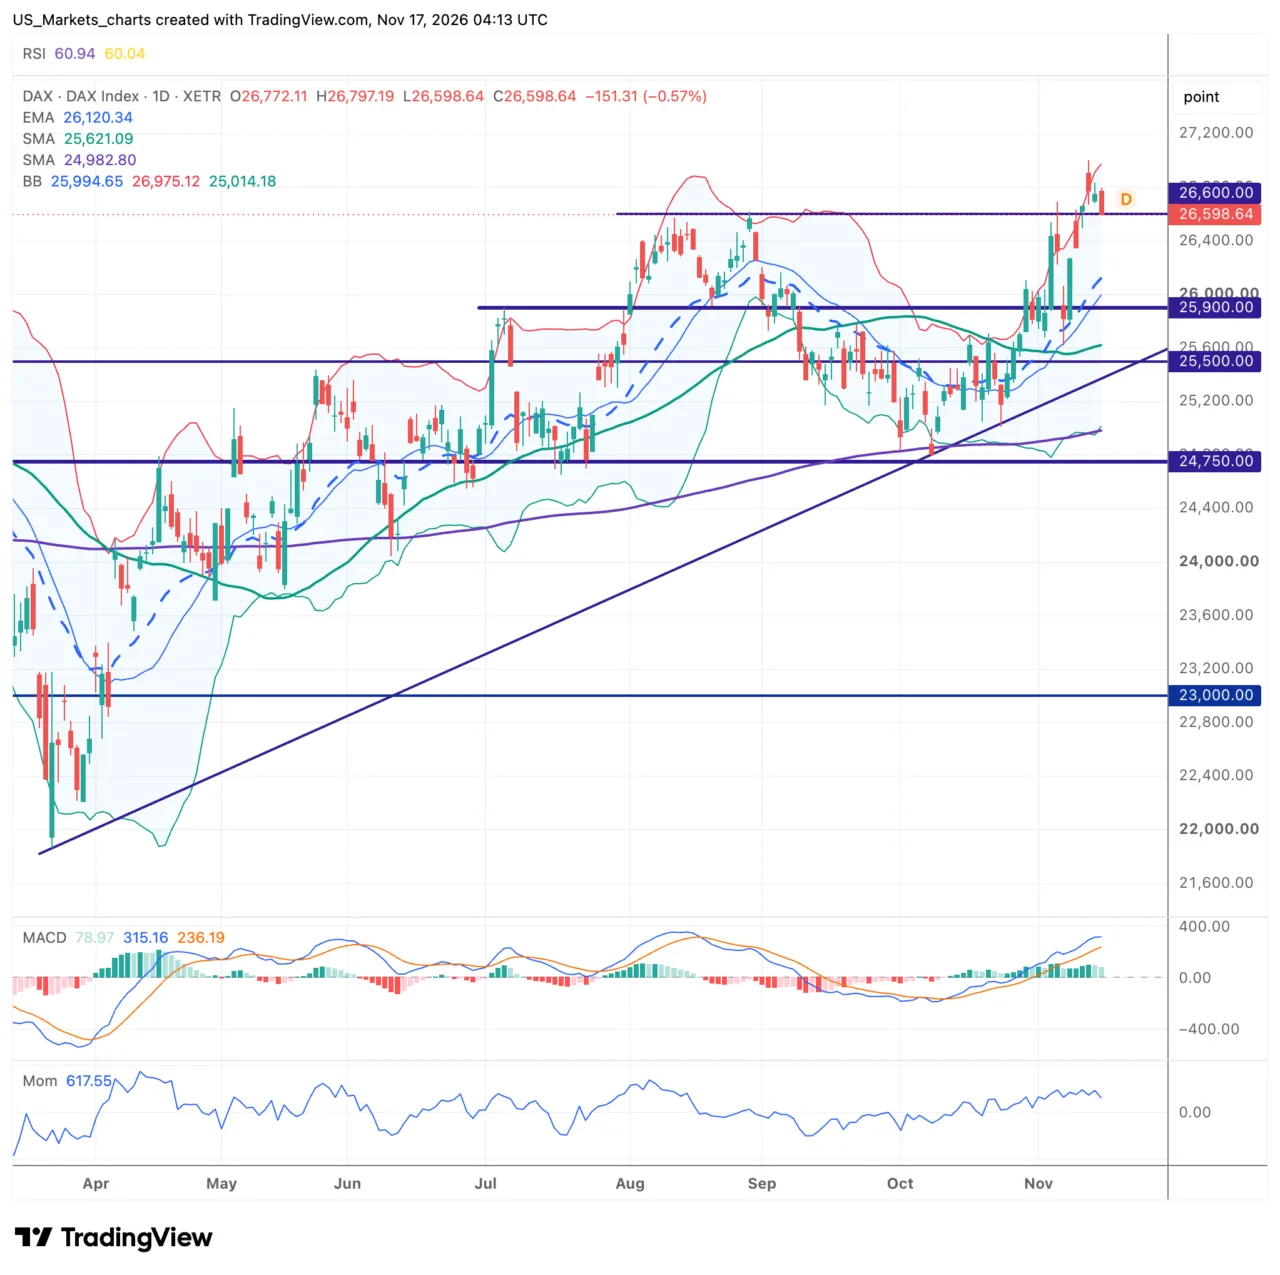
The DAX closed 0.57% lower on Monday at 26,599 points, after the index that same day still recorded a new peak at 26,797 points, just above 26,600, the same level where the climb also stalled in August. The price is trading well above the EMA-20, which comes in at 26,121 points, above the SMA-50, which comes in at 25,622 points, and also well above the SMA-200, which comes in at 24,983 points. The Bollinger Band is relatively wide, with an upper band around 26,975 and a lower band around 25,014, fitting the unrest of recent days. The RSI at 61 is not yet in overbought territory, the MACD remains well above the signal line and momentum is still positive, although the rise is cautiously becoming less powerful.
Click on the chart to view it at full size.
In short.
The SMA-200 is far below the price, the longer trend remains upward.
The EMA-20 holds as support just below the price.
The price still doesn't really get above the resistance at 26,600.
A possible double top is forming between 26,600 and 26,800.
The DAX remains in a clear rising trend on the daily chart since the April low, with higher highs and higher lows. The price still doesn't really get above the resistance at 26,600, the same level that already caused a reversal in August, and thus possibly forms a double top in the making. On a pullback the support around 25,900 holds, with the zone around 25,500 as the next safety net below.
For the coming sessions a new test of the resistance at 26,600 is the obvious thing, as long as the support at 25,900 stays intact. If the index falls below it, that is the level that invalidates this picture, after which the support at 25,500 will be put to the test.
|
|
Technical view Nasdaq 100
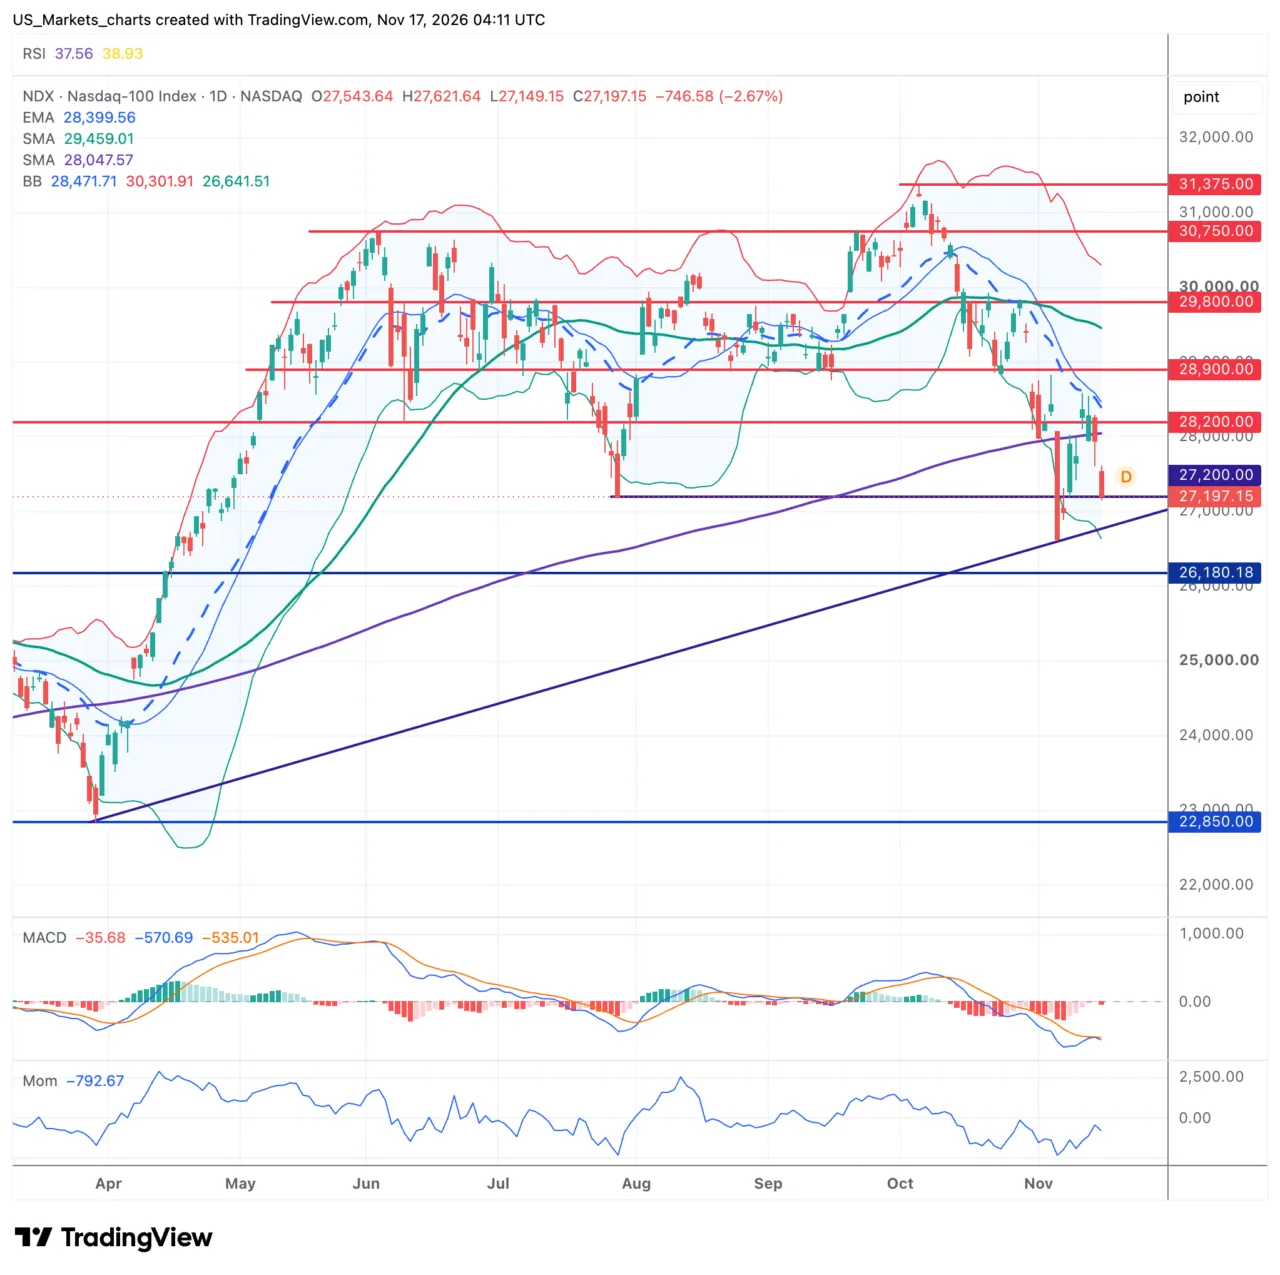
The Nasdaq 100 closed 2.67% lower on Monday at 27,197 points, after a session between 27,149 and 27,622 points, and thus again tested the zone around 27,200 that already served as a bottom in early August. The price is trading below the EMA-20, which comes in at 28,400 points, well below the SMA-50, which comes in at 29,460 points, and also below the SMA-200, which comes in at 28,048 points. The SMA-50 is still above the SMA-200, so for now there is no death cross. The Bollinger Band is unusually wide, a sign of the high unrest of recent days. The RSI at 38 is not yet in oversold territory, the MACD remains below the signal line and momentum is still clearly negative.
Click on the chart to view it at full size.
In short.
The SMA-50 is above the SMA-200, so the longer trend structure remains intact.
The support around 27,200 also caught the price in early August.
For the first time since April the price is also trading below the SMA-200.
The wide Bollinger Band points to persistently high price volatility.
The Nasdaq 100 sinks again after a test of the resistance at 28,200, with the zone around 28,900 as the next hurdle above. The support around 27,200 is being tested for the 2nd time since late July, which points to a possible double bottom forming, although it is not yet confirmed. There is no clear trend in the shorter term, since October the index has mainly moved downward within the longer rising structure.
For the coming sessions the support at 27,200 is the level to watch. If it holds, a new attempt toward 28,200 is the obvious thing. If the price falls structurally below it, that is the level that invalidates this picture and the zone around 26,180 comes into view.
|
|
Technical view SOX
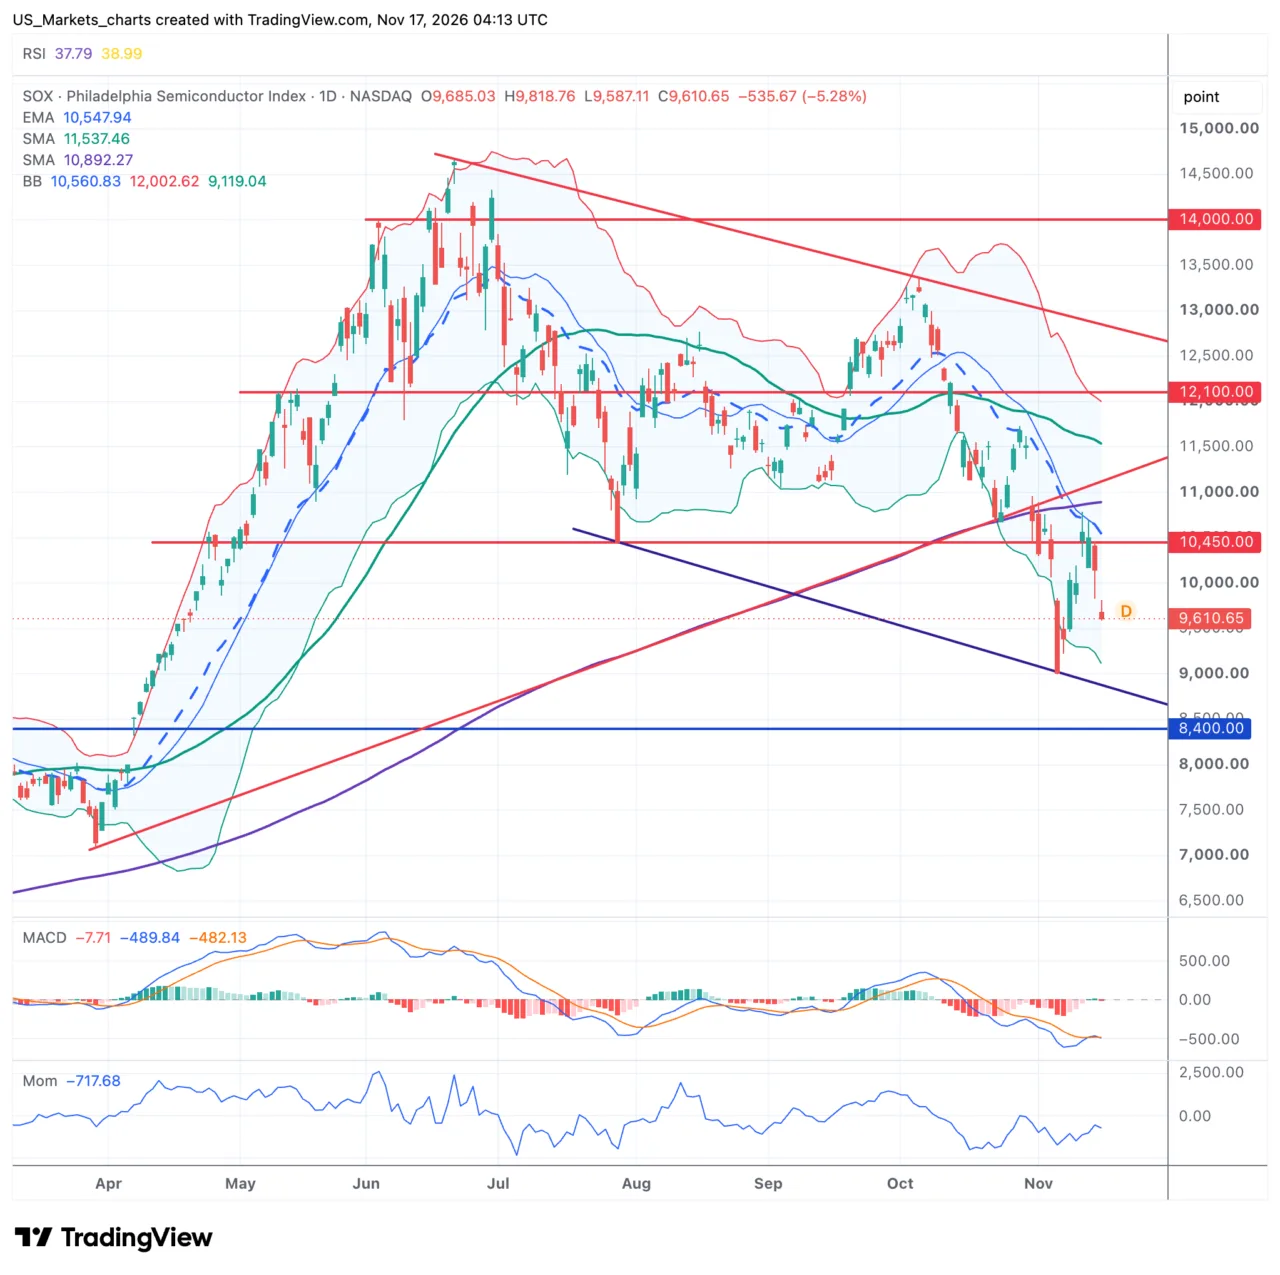
The Philadelphia Semiconductor index (SOX) dived another 5.28% lower on Monday to 9,611 points, and thus breaks further through the long running rising trend line from the early April low. The price is trading far below the EMA-20, which comes in at 10,548 points, even deeper below the SMA-50, which comes in at 11,538 points. Another negative signal is that the index is also below the SMA-200 at 10,893 points. The Bollinger Band is wide after the sharp decline of recent days. The RSI at 38 is just not yet in oversold territory, the MACD remains below the signal line and momentum is pronouncedly negative.
Click on the chart to view it at full size.
In short.
The SMA-50 is above the SMA-200, so there is no death cross yet.
The price breaks the rising trend line that held since April.
The support at 10,450 proved no longer tenable and now acts as resistance.
The wide Bollinger Band points to a markedly volatile market.
The SOX sinks again after losing the support around 10,450, which now acts as resistance. That also puts the long running rising trend line from April under further pressure. A clear reversal pattern is still just absent, the index mainly posts a sharp continuation of the decline since the July peak, with the zone around 8,400 as the next safety net. This index is already in a 'Bear Market'.
For the coming sessions the recovery of the trend line remains the level to watch. If that fails and the index falls further, a test of the support at 8,400 is the obvious thing. Only above 10,450 would the picture improve again.
|
Disclaimer:
All information in this update was checked as well as possible, but much is nowadays generated with the help of AI, so there may still be some mistakes in it. This update is not investment advice.
Sources:
TradingView, Investing.com, Yahoo Finance, MarketWatch, usmarkets.nl.
US Markets Editorial | www.usmarkets.nl
|
|