This page is a translation of the Dutch original.
|
|
US Markets Editorial Team
Europe tumbles, Nvidia divides opinion
Morning update Wednesday 18 November 2026
|
|
What stood out most is how Europe was hit harder than Wall Street this time. The AEX and the DAX both lost more than 2%, and the doubt now seems to have spread across the full breadth of the market. There has been no shortage of volatility in recent weeks, and I see no reason to think that will change soon. During this decline we were able to close the short position on the DAX at a profit, which fully straightens out the mediocre start to this month. For new positions we are deliberately in no hurry, first I want to see how the market behaves over the coming hours. That this caution is justified was also shown overnight by the futures, with the future on the Nasdaq 100 alone moving around 500 points between its highest and its lowest point. The figures from Nvidia were first well received, with a revenue forecast of $130 billion that analysts saw as the most important line of the whole report, but later in the night the mood turned back to more doubt. Meanwhile the IPO price of Anthropic is announced today, with the first trading day on the Nasdaq tomorrow.
|
|
Europe closes in the red, Nvidia and Anthropic dominate the news
Nvidia published quarterly figures on Tuesday after the US close that beat expectations, with a revenue forecast of $130 billion for the current quarter. The stock then rose 3.8% after hours. Chairman Harvey Jones confirmed during the presentation that the company does not intend to bring Jensen Huang back as CEO, a question that had hung over the market for some time. During the explanation of the figures, attention was also drawn to a more disciplined approach to financing, after margins were temporarily under pressure from price adjustments on existing orders.
Today the price is announced of the long awaited IPO of Anthropic, with a range between $70 and $78 per share and a valuation of roughly $1 trillion to $1.25 trillion, which is quite a bit less than the $2 trillion that was circulating earlier. Tomorrow follows the first trading day on the Nasdaq.
The IPO of Anthropic thus arrives in a market that is already sensitive to doubts about the valuation of AI companies.
|
Click on the image to view it at full size.
|
|
Wall Street sharply lower, tech stocks under pressure
Wall Street closed clearly lower on Tuesday. The Dow Jones lost 1.64% to 50,759 points, the S&P 500 gave up 1.03% to 7,341 points and the Nasdaq Composite fell 0.74% to 24,328 points. The Nasdaq 100 lost 0.72% to 27,002 points and the smaller Russell 2000 closed 1.50% lower. The chip index SOX was the exception and managed to rise 0.34% to 9,643 points. The fear index VIX shot up 11.1% to 25.45, the clearest signal of the increased unrest.
Salesforce was the biggest decliner in the S&P 500 with a loss of 9.45% to $194.52, amid broader unrest in software stocks. Datadog fell along with it, down 4.44% to $165.18. Microsoft lost 2.27% to $506.24, while Broadcom was an exception, gaining 2.46% to $341.60. Nvidia itself closed the regular session 0.44% lower at $155.46, before the figures after the bell. CoreWeave reacted positively after hours to the words of Nvidia about more disciplined financing.
On the bond market the 10 year yield stands at 5.09% and the 30 year yield at 5.44%, after the 10 year yield rose above 5% this week. Gold is at $3,788.27, 1.96% lower, and silver stands at $45.91, 3.06% lower. Bitcoin is almost flat at $64,604. Brent oil is trading this morning around $92.49 per barrel, 0.70% lower.
The sharp jump in the VIX coincides with a broad decline in which almost no sector was spared, although the SOX with a small gain was the exception to the rule. That Salesforce and Datadog were punished harder than the broader market points to persistent doubt about the valuation of software companies within the AI story.
|
Join our signals in the BLACK FRIDAY week?
Try Guy Systeem Trading now for just €25 until 1 FEBRUARY
You receive all positions directly by email and text message
Sign up right away via our Tradershop
|
|
Our results of the past 12 months
| Month | Result |
| November 2025 | €3,801 |
| December 2025 | €1,204 |
| January 2026 | €151 |
| February 2026 | €3,202 |
| March 2026 | €2,197 |
| April 2026 | -€940 |
| May 2026 | €1,268 |
| June 2026 | €601 |
| July 2026 | €837 |
| August 2026 | €931 |
| September 2026 | €896 |
| October 2026 | €1,506 |
| November 2026 (interim figure 18 November) | €116 |
| Total up to and including the November 2026 interim figure | €15,770 |
Past results offer no guarantee for the future.
|
|
AEX and DAX lose more than 2%, chip names hit hard
The AEX closed 2.14% lower on Tuesday at 1,109.9 points, while the DAX gave up 2.08% to 26,045 points. ASML lost 5.34% to €1,236.80, the heaviest decliner on the Damrak. Adyen fell 3.39% to €837.70, BE Semiconductor Industries (Besi) lost 3.05% to €146.20 and ASM International gave up 2.51% to €653.00. Shell held up better with a loss of 0.65% to €44.30.
|
|
Agenda and outlook for today
The US futures point flat for the Dow Jones this morning and higher for both the S&P 500 and the Nasdaq 100. In Europe the future on the DAX points lower, the one on the AEX slightly higher.
Today the price is announced for the IPO of Anthropic, with the first trading day on the Nasdaq tomorrow. The market is also digesting the quarterly figures and the words from the board of Nvidia from last night. The macro agenda is relatively quiet for the rest of today.
|
My view on today: profit taken, now patience for new opportunities
This time it was mainly the more traditional indices that had a hard time. The AEX and the DAX both lost more than 2%, and for me the doubt is now beginning to spread across the full breadth of the market. There has been no shortage of volatility in recent weeks, and I see no reason for that to change soon.
During this decline we were able to close the short position on the DAX at a profit. That brings us out ahead for the month overall, and so we wipe out the bad start to November. We can now look ahead to a few long positions, most likely about 3 on the indices, but without haste. First I want to wait and see how the market continues, because in this market you can make mistakes quickly. We also saw that overnight in the futures, with the Nasdaq future alone moving around 500 points between its highest and its lowest point.
We are trying to find the right momentum to send our signals to members by email and text message. Everyone then decides for themselves which positions to follow and which positions fit their own risk profile. Members must always enter the positions themselves with their own broker.
If you want to follow our updates and positions, then become a member via the offer you see in this update.
|
|
The psychology behind this market
A sharp decline like yesterday's, followed by a deliberate pause for our positions, touches a familiar theme in investor psychology. As soon as prices move sharply, doing nothing feels uncomfortable for many investors, even when waiting is the wisest choice at that moment.
This mechanism is known as patience, or rather the lack of it. Anyone who wants to jump straight back in after a big move is often driven by the urge to do something, not by a concrete opportunity.
From the coaching role at Guy Systeem Trading this point comes up often. Skipping a position because conditions are not yet convincing is just as much a decision as opening a position, and often the hardest of the 2.
“Patience feels like standing still, while it is really buying time to take the next step the right way.”
|
|
Technical view AEX
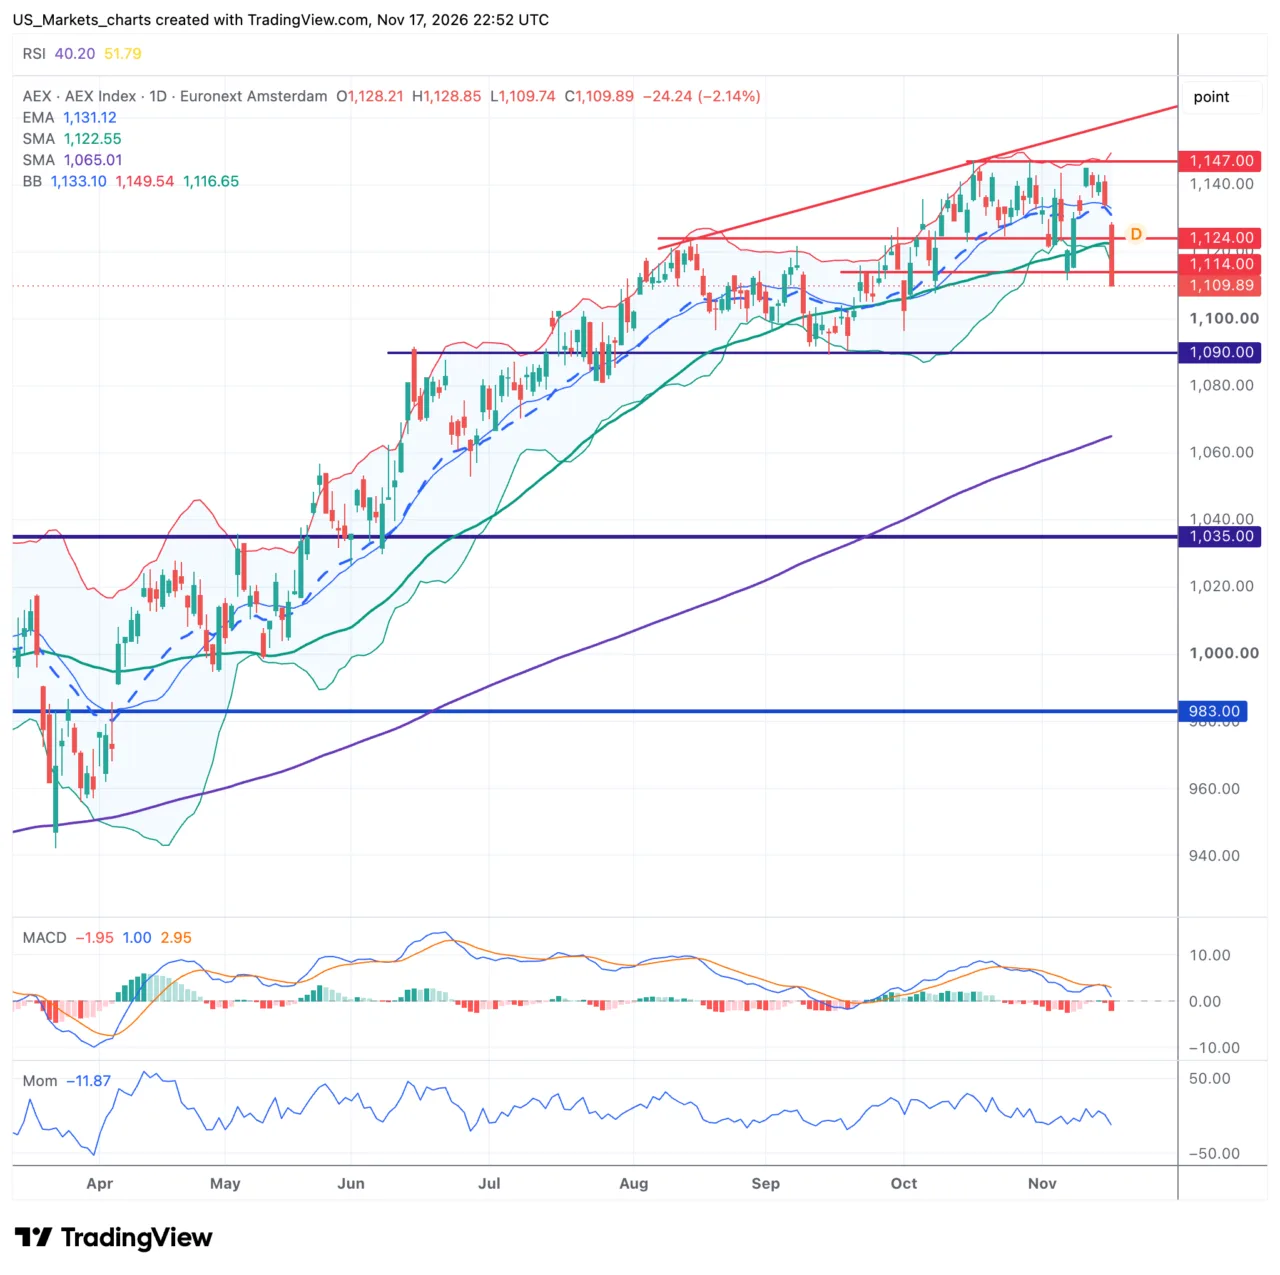
The AEX closed 2.14% lower on Tuesday at 1,110 points and is thus testing a zone around 1,111 that has already served as support and as resistance several times this year. The price is below the EMA-20, which stands at 1,132 points, below the SMA-50, which stands at 1,123 points, but still well above the SMA-200, which stands at 1,066 points. The price even dipped briefly below the lower Bollinger Band today, a solid signal of short term pressure after the sharp decline. The RSI stands at 40 and is not yet in oversold territory, the MACD is below the signal line and momentum is clearly negative.
Click on the chart to view it at full size.
In short.
The SMA-50 is still above the SMA-200, so the longer trend remains upward.
The zone around 1,111 has caught the price several times this year.
The price is below the EMA-20 and the SMA-50, a correction within the longer trend.
The price drops below the lower Bollinger Band, strong short term pressure.
On the daily chart the AEX has been in an uptrend since the low earlier this year, with higher highs and higher lows, but the direction of the last few days is a sharp correction within that trend. The support around 1,111 is still just holding today, with the zone around 1,096 as the next safety net below. The price no longer gets above the resistance at 1,123, where the SMA-50 also sits, with the resistance around 1,143 above that. There is no clear reversal pattern yet, the index is mainly starting a sharp correction after a recent record.
For the coming sessions a technical bounce towards the SMA-50 at 1,123 is likely, as long as the support at 1,111 holds. If the index drops durably below it, that is the level that invalidates this picture, after which the support at 1,096 is put to the test.
|
|
Technical view Nasdaq 100
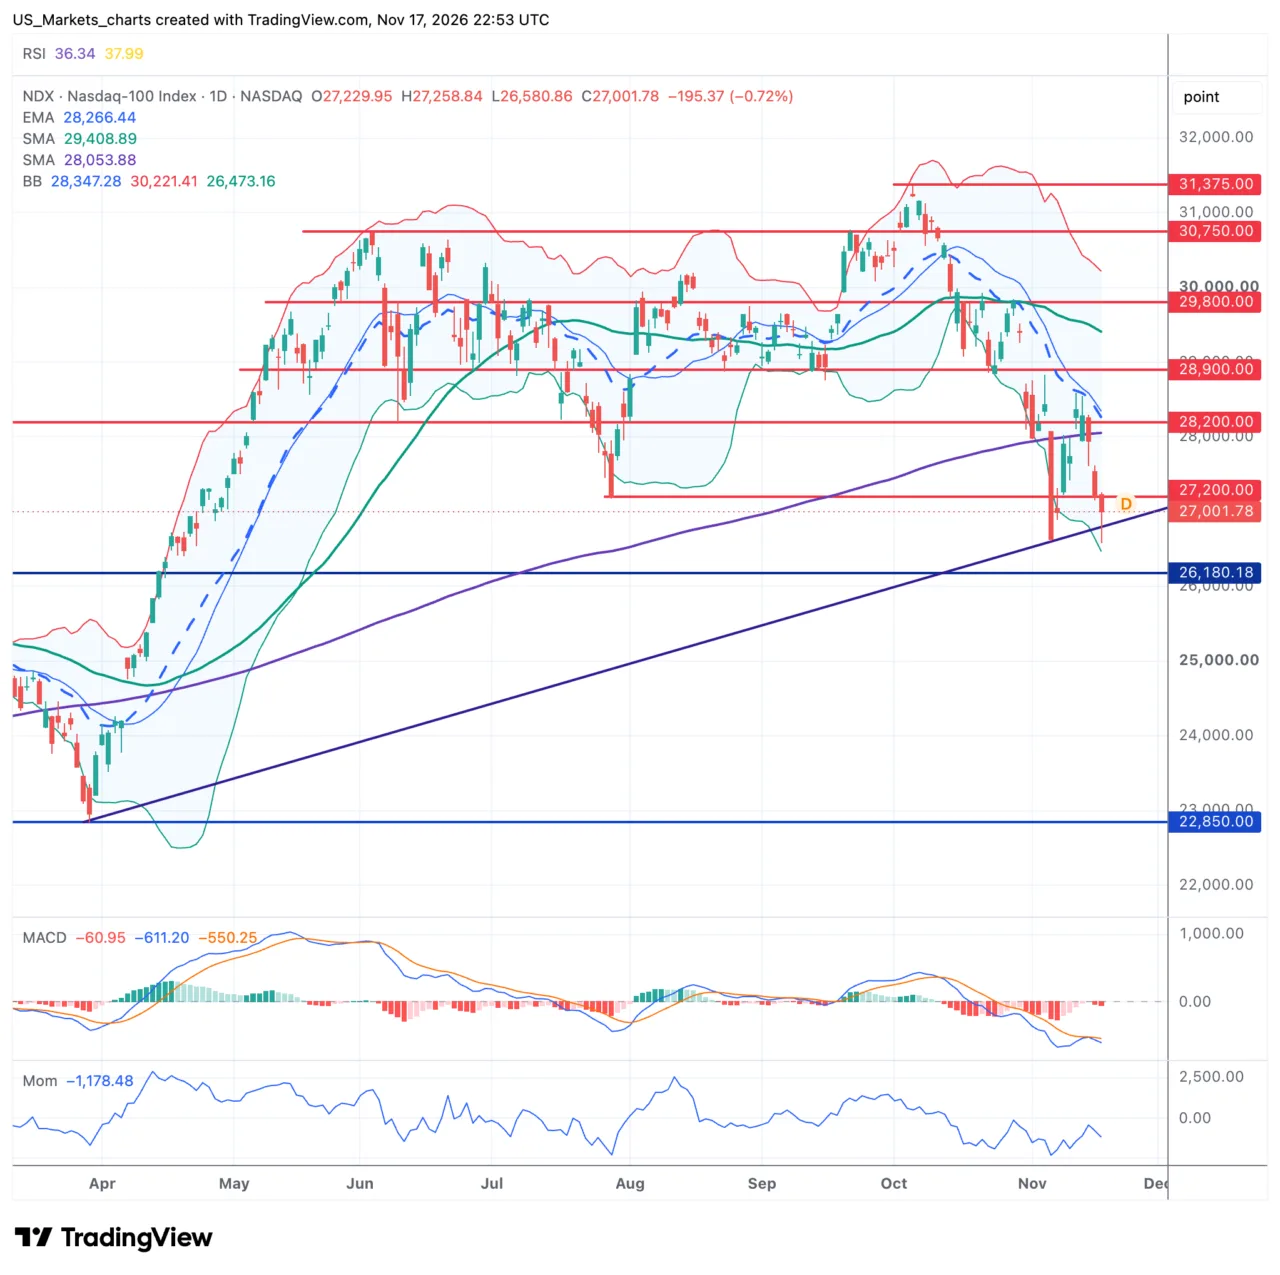
The Nasdaq 100 closed 0.72% lower on Tuesday at 27,002 points and tested the lowest level of recent weeks, around 26,630. The price is below the EMA-20, which stands at 28,267 points, below the SMA-50, which stands at 29,409 points, and also below the SMA-200, which stands at 28,054 points. The SMA-50 is still above the SMA-200, so there is no death cross yet. The Bollinger Band is unusually wide, in line with the high unrest of recent days. The RSI stands at 36 and is not yet in oversold territory, the MACD is below the signal line and momentum is clearly negative.
Click on the chart to view it at full size.
In short.
The SMA-50 is still above the SMA-200, so there is no death cross yet.
The price closes below the SMA-200, a warning signal.
The Bollinger Band is unusually wide, in line with the high volatility.
The index tested the lowest level of recent weeks today.
On the daily chart the Nasdaq 100 continues the downward correction since the peak of a few months ago, with lower highs and lower lows. The support around 26,630 is being tested today for the first time since this zone formed a low earlier, although that is not yet a confirmed pattern. The price does not get above the resistance around 28,267, where the EMA-20 also sits.
For the coming sessions the support at 26,630 is the level to watch. If it holds, a technical bounce towards the EMA-20 at 28,267 is likely. If the price drops durably below it, that is the level that invalidates this picture and a further continuation of the correction becomes more likely.
|
|
Technical view Dow Jones
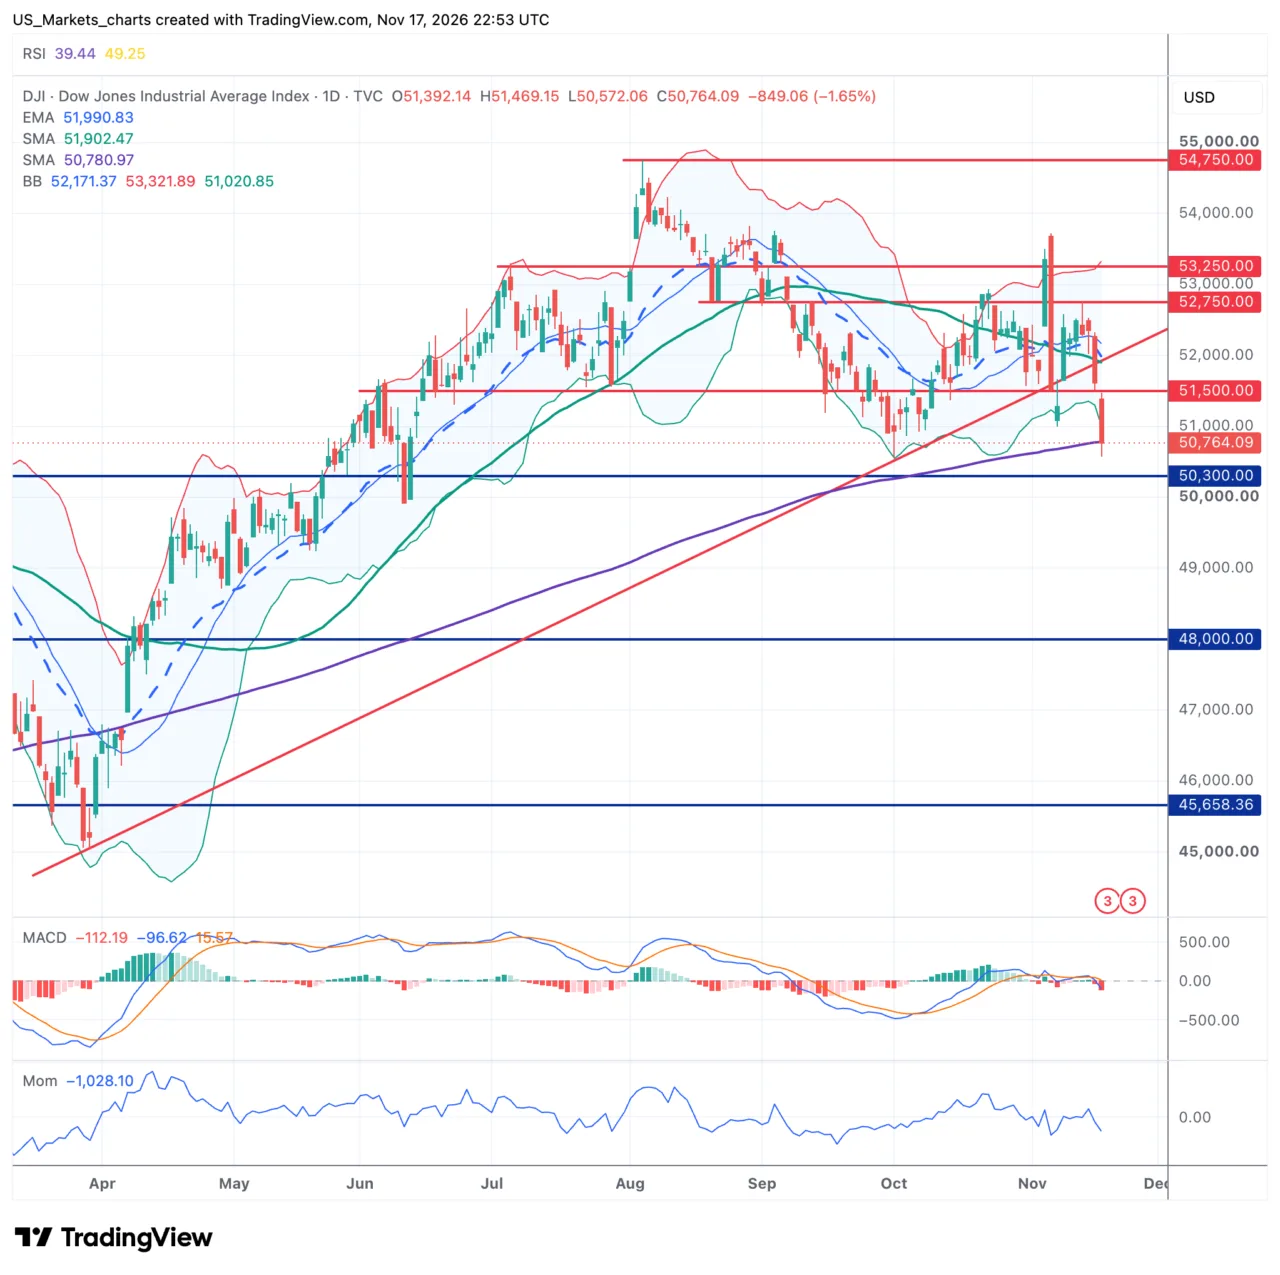
The Dow Jones closed 1.64% lower on Tuesday at 50,759 points, in the zone around 50,760 that has caught the price several times in the past. The price is below the EMA-20, which stands at 51,986 points, below the SMA-50, which stands at 51,898 points, and for the first time in months also below the SMA-200, which stands at 50,777 points. The SMA-50 is still above the SMA-200, so there is no death cross yet. The price also dropped below the lower Bollinger Band today, a solid signal of short term pressure. The RSI stands at 39 and is not yet in oversold territory, the MACD just crossed below the signal line and momentum is clearly negative.
Click on the chart to view it at full size.
In short.
The SMA-50 is still above the SMA-200, the longer trend structure remains intact.
The zone around 50,760 has caught the price several times in the past.
The price closes below the SMA-200 for the first time in months.
The price dropped below the lower Bollinger Band.
On the daily chart the Dow Jones continues a correction, with a clear acceleration downward in recent days. There is no clear reversal pattern, rather a sharp, fast correction that brought the index close to a zone tested more often. The support around 50,760 is just holding for now, with the zone around 49,910 as the next safety net.
For the coming sessions the position below the lower Bollinger Band can cause a technical counter move towards 51,500, as long as the support around 50,760 holds.
|
Disclaimer:
All information in this update was checked as well as possible, but a lot is nowadays generated with the help of AI, so there may still be some mistakes in it. This update is not investment advice.
Sources:
TradingView, Investing.com, Yahoo Finance, MarketWatch, usmarkets.nl.
US Markets Editorial Team | www.usmarkets.nl
|
|