This page is a translation of the Dutch original.
|
|
US Markets Editorial Team
Anthropic has to come back down after the peak, Wall Street sharply lower
Morning update Friday 20 November 2026
|
|
What stays with me most from yesterday is how quickly a blazing start can turn. Anthropic finally went public, at the very moment the euphoria peaked. It felt right away that the high opening would not hold, and so I took a short position on the Nasdaq 100. That instinct worked out well, and within an hour and a half we could already bank a nice profit on it. While the opening price for Anthropic was still being searched for, the other indices were already slipping, a clear signal that calm was still far away. That unrest paid no attention to the IPO itself and quickly spread to the rest of the market, which sent the Nasdaq 100 back into correction territory, while the SOX index lands back in bear market territory. The Dow Jones, the AEX and the DAX also fell back firmly. This morning that volatility continues right away, especially in technology. So it will be another session in which to stay sharp, without taking unnecessary risks. I do see a few support levels coming into view where we may be able to do something with positions.
|
|
Biggest IPO ever ends on a sour note
Anthropic (ANT) made its long awaited debut on the Nasdaq on Thursday, in what by the company's own figures is the biggest IPO ever. The stock was priced at $83 and raised a record amount of about $81.3 billion. In first trading Anthropic opened at $111.50, 34% above the offer price, good for a market value of more than $1.5 trillion at that moment. Within about 2 hours, however, the stock slid some 13% below that first price, one of the weakest starts for a major IPO since 2008.
The stock recovered some of the loss and eventually closed at $97.17, a gain of 17% compared with the offer price, but after hours Anthropic gave up ground again. Retail investors were out in force on the first trading day, although the inflow lagged behind that of the SpaceX IPO earlier this year, according to Vanda Research.
Chipmaker AMD took a separate hit after a critical report from Hunterbrook Capital about the company's ties with China, and lost more than 7% as a result.
That the biggest IPO ever lost a good part of its gains within a few hours says perhaps more about the expectations beforehand than about Anthropic itself. Investors who had counted on a straight line up got a hard lesson in how quickly enthusiasm can flip once the first euphoria fades.
|
|
Wall Street sharply lower, AMD the biggest decliner
Wall Street closed sharply lower on Thursday. The Dow Jones lost 2.19% to 49,097 points, once again falling below its own 200 day average. The S&P 500 gave up 2.02% to 7,176 points and the Nasdaq Composite lost 2.25% to 23,879 points. The Nasdaq 100 fell 2.21% to 26,517 points, the SOX chip index lost about 2.4% and the smaller Russell 2000 gave up 2.18%. The VIX fear index jumped to 28, its highest level in weeks.
Nvidia lost 3.30% to $145.98 and Broadcom fell 2.09% to $346.65. AMD was the biggest decliner with a loss of 7.72% to $489.19, after Hunterbrook Capital published a critical report on the company's exposure to China. Amazon (-3.87% to $257.37), SanDisk (-2.71% to $755.16) and Micron (-2.10% to $690.44) also went lower. Intel was one of the few positive exceptions with a gain of 1.92% to $55.72, as was Palo Alto Networks, which built on its strong results from earlier this week with 6.42% to $361.73.
In the bond market the 10 year yield stands at 5.01% and the 30 year yield at 5.38%. Gold trades at $3,554, 3.5% lower, and silver stands at $41.6, 6% lower. Bitcoin trades around $61,700, 3.2% lower. Brent oil trades this morning around $92.6 a barrel, 0.75% higher.
The simultaneous drop in stocks, precious metals and bitcoin points to a broad flight from risk, rather than concerns about 1 single part of the market. The sharp jump in the VIX confirms that the unrest goes further than an ordinary price move.
|
Want to join our signals?
Try Guy Systeem Trading now through the BLACK FRIDAY offer for
Now €25 until 1 FEBRUARY and receive everything directly by email and SMS
Schrijf je in via onze Tradershop
|
|
Our results of the past 12 months
| Month | Result |
| November 2025 | €3,801 |
| December 2025 | €1,204 |
| January 2026 | €151 |
| February 2026 | €3,202 |
| March 2026 | €2,197 |
| April 2026 | -€940 |
| May 2026 | €1,268 |
| June 2026 | €601 |
| July 2026 | €837 |
| August 2026 | €931 |
| September 2026 | €896 |
| October 2026 | €1,506 |
| November 2026 (interim 20 November) | €442 |
| Total up to and including the November 2026 interim figure | €16,100 |
Results achieved in the past offer no guarantee for the future.
|
|
AEX and DAX lower, European chip names in the green instead
On the Damrak the AEX closed 0.62% lower on Thursday at 1,091.94 points, while the DAX lost 1.06% to 25,463.81 points. The chip names were on the winning side in Europe instead. ASML gained 2.17% to €1,288.20, ASM International rose 2.87% to €689.20, BE Semiconductor Industries (Besi) climbed 1.34% to €151.20 and Infineon gained 0.28% to €49.35.
SAP, on the other hand, gave up 3.56% to €187.02, Prosus fell 1.32% to €32.10, Shell lost 1.13% to €42.85 and ING gave up 0.60% to €28.20.
|
|
Agenda and outlook for today
US futures point lower again this morning. In Europe, the futures on the DAX and the AEX point sharply lower.
On today's macro agenda the main item is a speech by ECB president Lagarde. After a busy week with the Fed minutes, the figures from Walmart and the Anthropic IPO, today's agenda is quieter, and the attention is mainly on how the market digests yesterday's events.
|
My view on today, profit taken at the top of a blazing start
What a session that was yesterday, one of the most volatile of this entire year, and on the very day that Anthropic went public. The offer price was $83, with a peak up to some $115 and a close around $97. Around the open the Nasdaq was still some 600 points higher, but that was quickly wiped out right after trading began.
At some point I had the feeling that this high opening would not hold, and around the top we took a short position. It stayed open for only an hour and a half, because the Nasdaq dropped sharply and we could quickly secure a nice profit. We did not have to take much risk, because the other indices were already starting to slip and the opening price for Anthropic still had to be found, so a top on the Nasdaq 100 seemed fairly obvious.
The IPO did turn out a success in the end, but certainly not a mega success with an extremely high price. Anthropic does settle straight away among the trillion dollar companies, with a market value of about $1.27 trillion, good for 12th place worldwide.
We have now had the Anthropic IPO, and we can tick that item off. The market did not come alive because of it, quite the opposite, as I had already half expected. We were able to keep a nice position on the Nasdaq 100, an index that is by now back in correction territory, while the SOX index ends up in bear market territory again. The Dow Jones is now also quickly following in the negative direction, as are the AEX and the DAX, which did better earlier but are now sliding along with the rest. It is not over yet, certainly not when it comes to volatility.
This morning we notice that the markets are again starting with a good deal of volatility, especially in technology, where the future on the Nasdaq 100 slips further toward the support around 26,180 points. The S&P 500, the DAX, the AEX and the Dow Jones are also slipping further. After closing this position we end this very difficult month in profit after all. We are not taking big risks in this phase. A sharp reaction higher can come at any moment, but the pressure to the downside, as we noticed yesterday, has not completely gone away. Yesterday the market was still hoping that Anthropic would provide a big lift, but it turns out differently.
We are trying to find the right momentum to send our signals to the members by email and SMS. Everyone then decides for themselves which positions to follow and which positions fit their own risk profile. Members must always enter the positions with their own broker themselves.
If you want to follow our updates and positions, become a member through the offer you see in this update.
|
|
The psychology behind this market
A blazing start like that of Anthropic yesterday first felt like a confirmation to many investors, but later like a disappointment. The price shoots up, the enthusiasm was great, and the temptation to still step in grew stronger by the minute. Then the price fell back sharply.
From the coaching role at Guy Systeem Trading this pattern comes up often. Overconfidence does not arise because investors are foolish, but because a rising price gives the feeling that the risk has disappeared, while in reality that risk is still very much there. Only when the price has given back a good part of the gains again does that difference become painfully clear.
“Overconfidence would love to buy the opening right away, and only afterwards does anyone ask whether the price is sustainable.”
|
|
Technical picture AEX
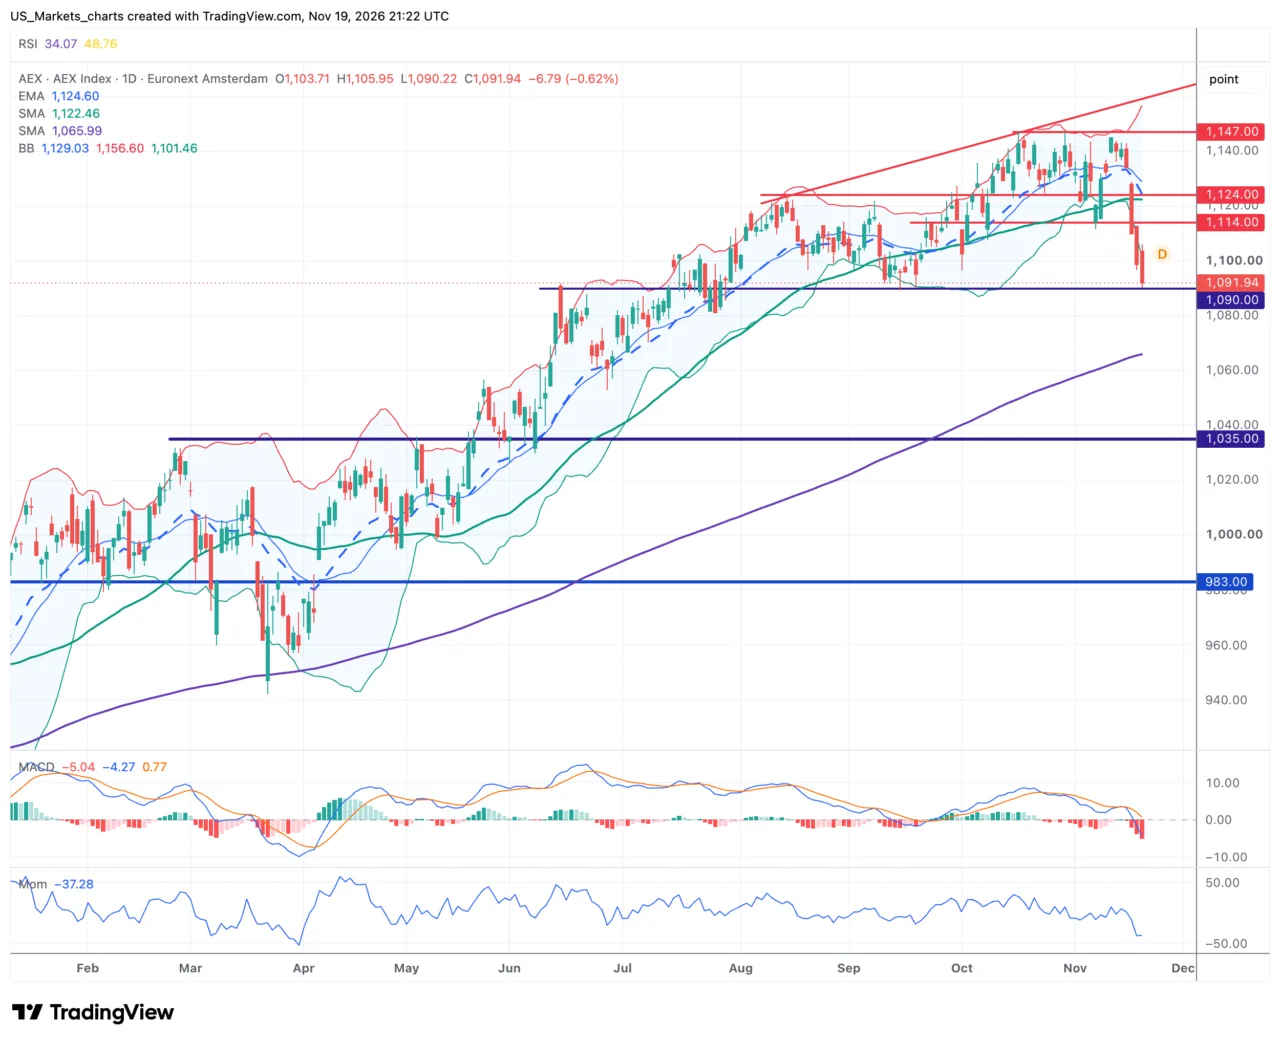
The AEX closed 0.62% lower on Thursday at 1,091.94 points and fell below the lower Bollinger Band for the 2nd day in a row, a firm signal of short term pressure. The price trades below the EMA-20, which comes in at 1,125 points, and below the SMA-50, which comes in at 1,123 points, but still above the SMA-200, which comes in at 1,066 points. Along the way the index broke through the rising trend line that had been below the price since the summer. The RSI at 34 is just not yet in oversold territory, the MACD is below the signal line and below the zero line, and the momentum is now clearly negative.
Click on the chart to view it at full size.
In short.
The SMA-50 is still above the SMA-200, so the longer trend remains upward.
The zone around 1,090 caught the price more than once earlier this year.
The price is now below the EMA-20 and the SMA-50, a correction within the longer trend.
The price fell below the lower Bollinger Band for the 2nd day in a row and broke a rising trend line.
On the daily chart the AEX is still in a rising trend since the low earlier this year, with higher tops and higher bottoms, but the correction of the past days is accelerating, including a break of the rising trend line that accompanied the price since the summer. The support around 1,090 just about holds today, with the zone around 1,035 as the next safety net below it. The price fails to get above the resistance at 1,114, with the resistance around 1,124 above that. There is no clear reversal pattern, the index mainly puts down a sharp correction after a recent record.
For the coming sessions a technical rebound toward the resistance at 1,114 is the obvious expectation, as long as the support at 1,090 stays in place. If the index sinks durably below it, that is the level that invalidates this picture, after which the support at 1,065 and 1,035 will be tested.
|
|
Technical picture Dow Jones
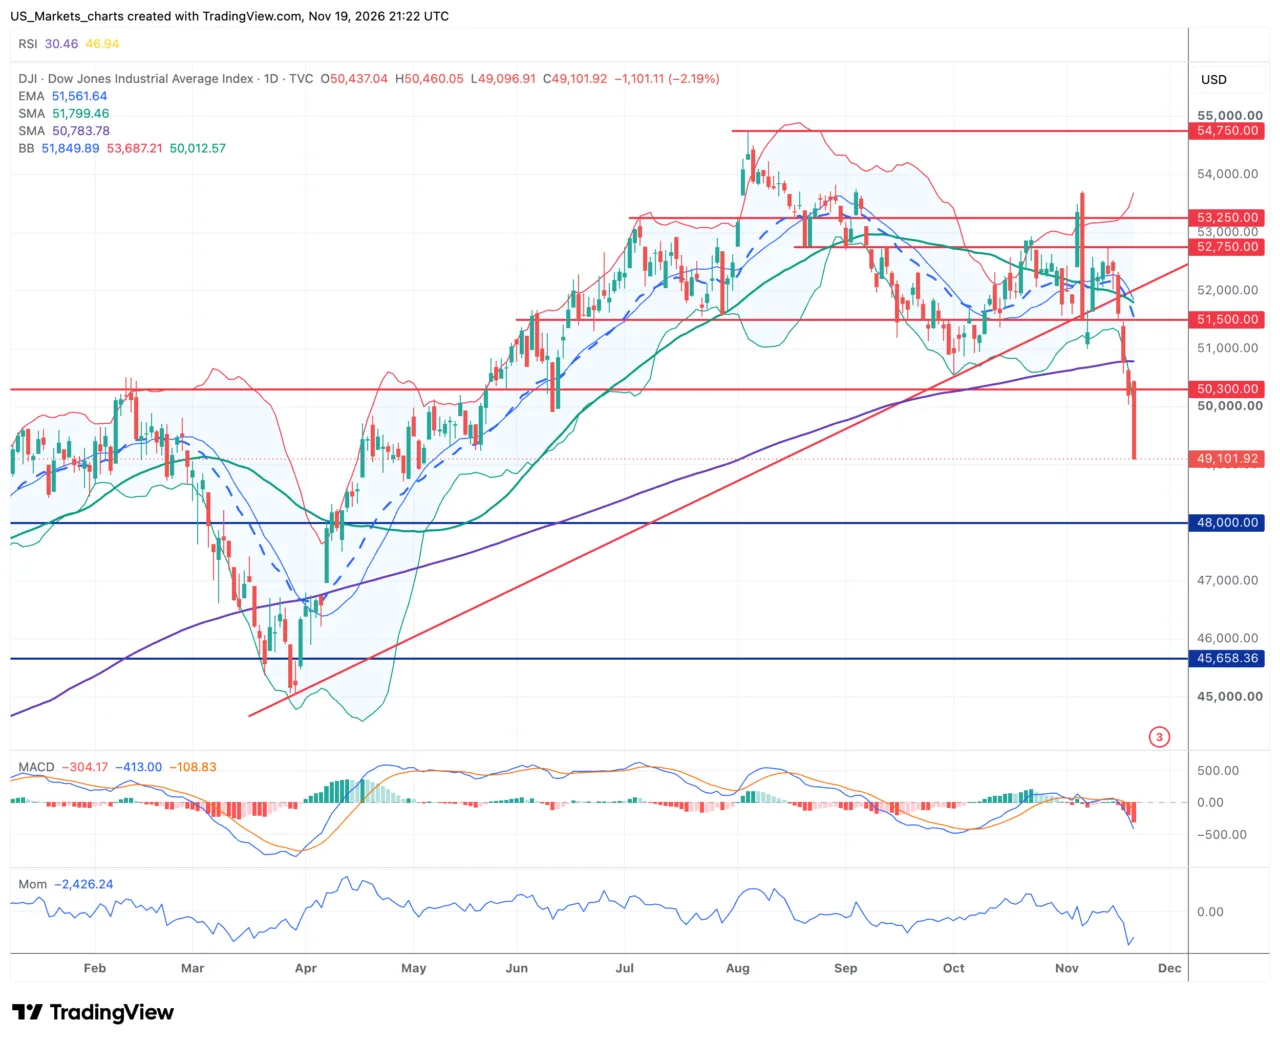
The Dow Jones closed 2.19% lower on Thursday at 49,097 points and fell below the SMA-200 for the 2nd day in a row, which comes in at 50,784 points. The price also trades below the EMA-20, which comes in at 51,562 points, and below the SMA-50, which comes in at 51,800 points. The SMA-50 is still above the SMA-200, but they are now quickly approaching each other. The price also fell below the lower Bollinger Band, a firm signal of short term pressure, and broke a rising trend line that had been below the price since the spring. The RSI at 31 is just not yet in oversold territory, and the momentum is strongly negative.
Click on the chart to view it at full size.
In short.
The SMA-50 is still above the SMA-200, so the longer trend structure remains intact.
The zone around 48,000 caught the price more than once in the past.
The price closes below the SMA-200 for the 2nd day in a row, a persistent warning signal.
The price fell below the lower Bollinger Band and broke a rising trend line, a sign of persistent short term pressure.
On the daily chart the Dow Jones continues the correction after the peak of a few months ago, with a clear acceleration to the downside in the last days, including a break of the rising trend line that accompanied the price since the spring. There is no clear reversal pattern, rather a sharp correction that has sent the index past the zone around 50,300. The support there did not hold, which makes the zone around 48,000 the next safety net. The price no longer gets above the resistance around 51,500, with resistance around 52,750 above that.
For the coming sessions a technical counter move toward the zone around 50,300 is the obvious expectation first, possibly even toward the SMA-200 at 50,784, as long as the support at 48,000 ultimately stays in place. A durable close below 48,000 is the level that invalidates this picture entirely.
|
|
Technical picture Nasdaq 100
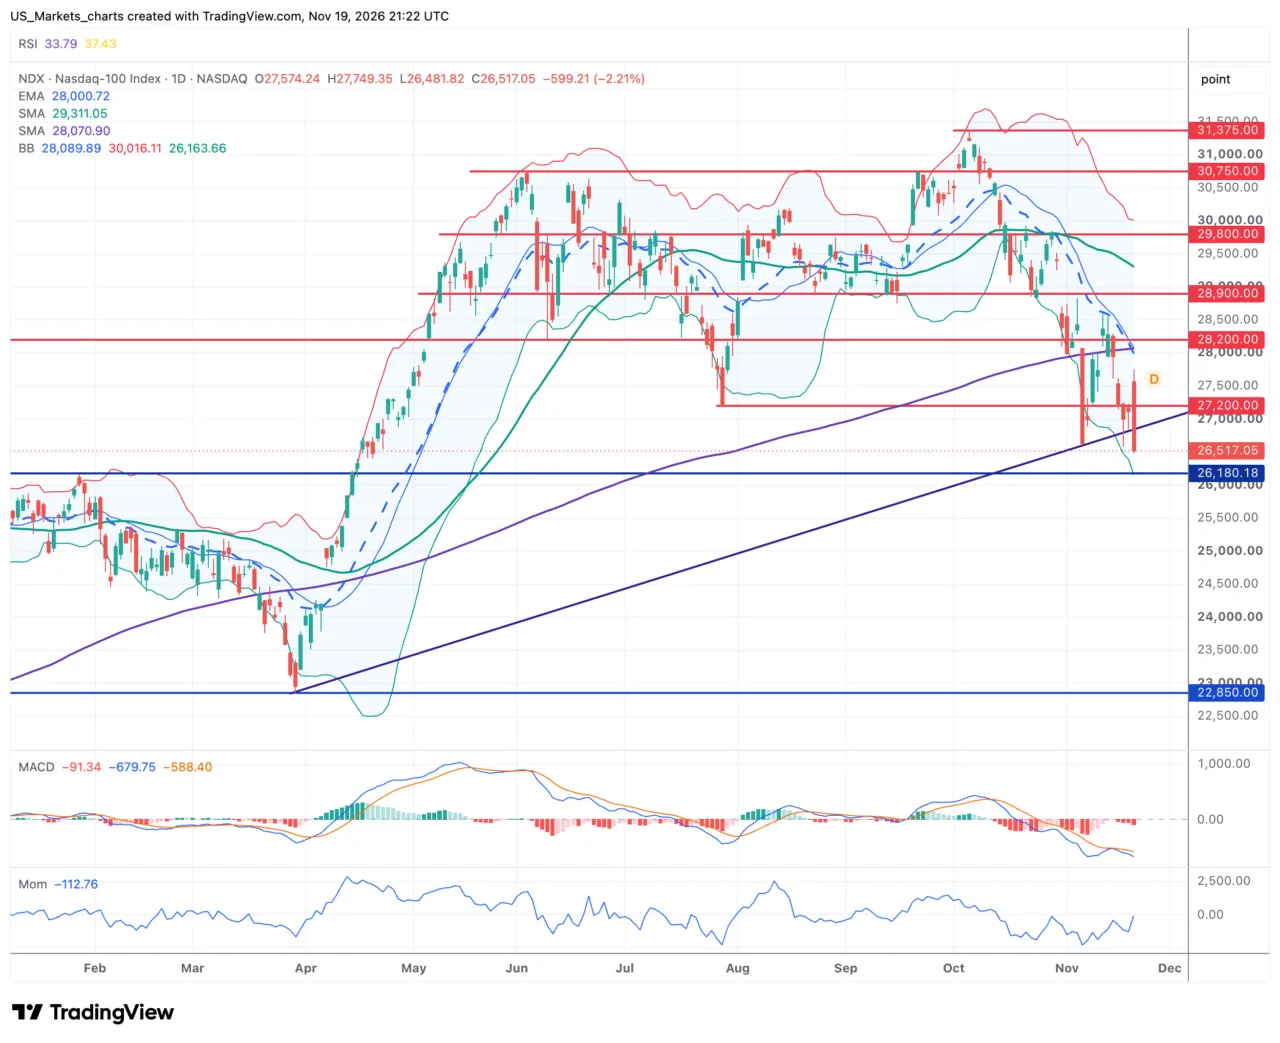
The Nasdaq 100 lost 2.21% on Thursday and closed at 26,517 points, definitively breaking the zone around 27,200 that still counted as a possible double bottom on Wednesday. The price trades below the EMA-20, which comes in at 28,000 points, below the SMA-50, which comes in at 29,312 points, and also well below the SMA-200, which comes in at 28,071 points. The SMA-50 is still above the SMA-200. The Bollinger Band is unusually wide, with the price close to the lower band, in line with the unrest of the last days. The RSI at 34 is just not yet in oversold territory, the momentum remains clearly negative.
Click on the chart to view it at full size.
In short.
The SMA-50 is still above the SMA-200, so there is no death cross yet.
The price approaches the lower Bollinger Band without breaking it, the decline may lose some strength there.
The price broke the zone around 27,200, so the possible double bottom of the past days is no longer valid. Watch the 26,180 now.
The Bollinger Band is unusually wide, in line with the high volatility of recent sessions.
On the daily chart the Nasdaq 100 continues a clear downward correction since the peak of a few months ago, with lower tops and lower bottoms. Where the index still showed a possible double bottom around 27,200 on Wednesday, yesterday's close wipes that scenario off the table. The price no longer gets above the resistance at 28,200, where the EMA-20 also sits just below. The next resistance comes in around 28,900. The support around 26,180 now sits just below the price, as does the lower Bollinger Band. Watch closely in the coming sessions, it could become a buying moment.
For the coming sessions the support at 26,180 is the level to watch, where the old tops from the end of last year and February this year are waiting, which could become a strong support. If it holds, a technical rebound toward the resistance at 27,200 and even 28,200 is the obvious expectation. If the price sinks durably below that 26,180, that is the level that invalidates this picture, after which we only see support at 22,850.
|
Disclaimer:
All information in this update was checked as well as possible, but a lot is nowadays generated with the help of AI, so some small mistakes may still have slipped in. This update is not investment advice.
Sources:
Yahoo Finance, CNBC, TheStreet, ABM Financial News, Investing.com, TradingView.
US Markets Editorial Team | www.usmarkets.nl
|
|