|
|
Chip sector catches its breath, Huang under fire
Morning update Monday 9 November 2026
|
|
At the start of this new trading week, futures are higher across the board, especially in the classic sectors. Only the Nasdaq 100 future stays more modest, with the background being the internal investigation that Nvidia announced on Sunday into the ties between CEO Jensen Huang and an alleged Chinese spy. The chip sector has to digest another test, after a week in which some names lost more than 50% from their June peak. Last week was one of the most violent in a long time, with a drop that hit almost every index and sector. This week I am mostly thinking about what we are going to do, and whether there will be room for new positions once the market chooses a clearer direction. There is also the upcoming IPO of Anthropic, which the market may count on as a new confidence signal for the AI trade. It now looks like it comes at a rather unfortunate moment.
|
|
Nvidia board steps in after spy affair around Huang
Nvidia suddenly announced over the weekend that its own board is investigating whether CEO Jensen Huang was the target of a foreign intelligence operation. The trigger is earlier reports about his close business ties with Alice Huang, a former senior executive at the Singaporean chip company MegaSpeed, who according to US officials would work for Chinese intelligence services. Jensen Huang stays on as CEO for now and is cooperating with the investigation, which is supervised by outside lawyers.
The case comes at a sensitive moment for the whole chip sector, which is still recovering from last Thursday's heavy sell-off. According to analysts at StoneX and Stifel, a technical reflex bounce followed that crash on Friday, but uncertainty about future data center spending remains a reason for further swings. The upcoming IPO of Anthropic, on which the AI sector counts as a new confidence signal, also comes at a very unfortunate moment according to market reports, with talk that the expected valuation of about $2 trillion is now sliding toward $1 trillion.
A governance issue at 1 of the heaviest weights of the AI rally hits the whole sector faster than a poor quarterly report at a smaller name would. The timing, shortly before an IPO that is meant to serve as a benchmark for AI valuations, makes the news even more sensitive. The fact that investors still bought back the chip names on Friday suggests that Thursday's decline was partly seen as exaggerated.
|
|
Chips bounce back, Dow Jones the only laggard
Wall Street closed mixed on Friday. The Dow Jones fell 0.46% to 51,286 points, while the S&P 500 gained 0.31% to 7,377 points. The Nasdaq Composite rose 1.09% to 24,579 points and the Nasdaq 100 climbed 1.35% to 26,990 points. The SOX chip index rebounded the strongest with a gain of 4.21% to 9,390 points, after the plunge of more than 12% a day earlier.
The chip names especially led the way. Micron Technology gained 5.12% to $690, partly thanks to an online debate about a price that some analysts consider too low. Intel rose 7.7% to $56.28 and AMD even 11% to $449. Nvidia recovered 2.78% to $186.64 and SanDisk 3.55% to $835.
Outside the chip sector, Tesla gained 4.23% to $358.22, after reports that Elon Musk is open to a major acquisition within SpaceX, while the Cybertruck is being discontinued. Apple (down 0.52% to $342.37) and Microsoft (down 1% to $530.6) lagged somewhat.
The 10 year yield stands at 4.86% and the 30 year yield at 5.27%. Gold trades at $4,120, up about 1.1%, and silver at $52.5, also about 1.1% higher. Bitcoin trades around $74,400 and so remains under pressure. Brent oil stands this morning at $96.6 per barrel, down about 1.7%, with attention still on a possible Qatari proposal for the Strait of Hormuz.
The picture is more mixed than the headlines suggest. While the chip names make up a good part of Thursday's damage, the broad Dow Jones remains the only one of the 5 indices in the red, a sign that the recovery is mainly concentrated in the most heavily punished names.
|
|
|
|
Our results of the past 12 months
| Month | Result |
| November 2025 | €3,801 |
| December 2025 | €1,204 |
| January 2026 | €151 |
| February 2026 | €3,202 |
| March 2026 | €2,197 |
| April 2026 | -€940 |
| May 2026 | €1,268 |
| June 2026 | €601 |
| July 2026 | €837 |
| August 2026 | €931 |
| September 2026 | €896 |
| October 2026 | €1,506 |
| November 2026 (interim figure 7 November) | -€608 |
| Total including the interim figure for November 2026 | €15,046 |
Past results offer no guarantee for the future.
|
|
AEX tests support, DAX now feels extra pressure too
The AEX closed 0.77% lower on Friday at 1,120.6 points. The DAX lost 1.92% to 25,820 points, a good deal more than the AEX, partly due to the heavier weighting of German industry.
ASML still gained 2.69% to €1,283.60 and ASM International 2.39% to €651.00, both recovering from the chip sell-off. BE Semiconductor Industries (BESI) rose 1.77% to €143.40. Adyen climbed 0.97% to €901.20. Shell lost 1.54% to €44.74.
On the DAX, Siemens (down 3.51% to €263.65) and SAP (down 2.32% to €210.75) gave up a lot, while Infineon, down 0.42% to €45.76, limited the damage.
Europe looks more mixed than the US, with the Dutch chip names riding along with the American recovery of the sector while the broader German industry and software names lose ground.
|
|
Agenda and outlook today
At the start of the new trading week the US futures point somewhat divided. The futures on the Dow Jones and the S&P 500 are higher and the one on the Nasdaq 100 is slightly lower. In Europe the futures on the DAX and the AEX are slightly lower.
On today's agenda are German trade balance figures, the Sentix investor index for the eurozone and a series of US Treasury auctions.
Investors are also closely watching the developments around the board investigation at Nvidia and the IPO of Anthropic, as both dossiers can feed through into sentiment around AI stocks.
|
Trader Guy's view: Searching for the right momentum after a heavy week
At the start of the new week futures are higher, mainly via the traditional sectors. Only the Nasdaq 100 future hardly moves, and in my view that has to do with the problems around Nvidia of the past few days. According to reports, CEO Jensen Huang would have had a relationship with an alleged Chinese female spy, and the board is now having that investigated. It shows that even the head of such a large company can unknowingly go badly wrong.
The chip sector was already under pressure from questions about financing, the power of companies like Nvidia and the possible curbing of data center construction, and is now going through an enormous correction. Some chip companies are already 50% or more below their peak. When investors realize they bought shares too expensively, you get phases like this, which in some sectors already lie in bear market territory. Briefly, the difference. We speak of a correction at a decline of 10% to 20% from the peak, a bear market starts at 20% or more and often goes together with a gloomy sentiment.
Last week was fierce, with a heavy drop in almost all indices and sectors. Investors become more cautious as a result, and traders who took a lot of risk have probably lost much buying power. Quite some damage has been done to the bulls, so a quick and strong rally will not simply arrive.
Anthropic:
Then there is the IPO of Anthropic, which normally should be coming. I wonder how the value of the company is developing now. There is an Anthropic Perpetual Future, a contract without an end date that trades on crypto platforms such as Binance. You do not buy shares with it, you only speculate on the expected value of the company ahead of the IPO, so it is not a share price, but it is a gauge of how investors think about the valuation. It now stands at about $1,380, against $2,150 at the start of October. It remains to be seen whether Anthropic still wants to go public in this phase. In short, is there still a way back?
We therefore have to think carefully about what we do this week, and calmly keep looking for new opportunities. In Trading only the S&P 500 Booster Long is still running, with a target and a stop loss. Given the futures we have some time left to decide. If a 'bear market rally' gets going that lasts a bit longer, we will also consider a few short positions, but we first look for the best momentum.
We always try to find the best momentum to send our signals to members by email and SMS. Everyone then decides for themselves which positions to follow and which positions fit their own risk profile. Members must always enter the positions with their own broker themselves.
Warning on turbos and boosters: turbos and boosters are complex products with a high risk. You can lose your entire investment.
If you want to follow our updates and positions, become a member via the offer you see in this update.
|
|
The psychology behind this market
A decline that feels like a buying opportunity often arises from anchoring. Investors keep using the June peak as a reference point, so a price that is now 30% or 50% below it feels cheap, even when the underlying outlook has changed in the meantime. The brain holds on to the last known high level instead of assessing the current situation.
From the coaching role at Guy Systeem Trading this pattern comes back regularly after a sharp correction like this one. Whoever is aware of that anchor looks sooner at what a price is worth now based on current figures and sentiment, instead of at the distance to an old record. Discipline and a predetermined plan remain the best counterweight to an anchor that distorts reality.
"An investor who clings to an old peak drifts even further away from reality."
|
|
Technical view AEX
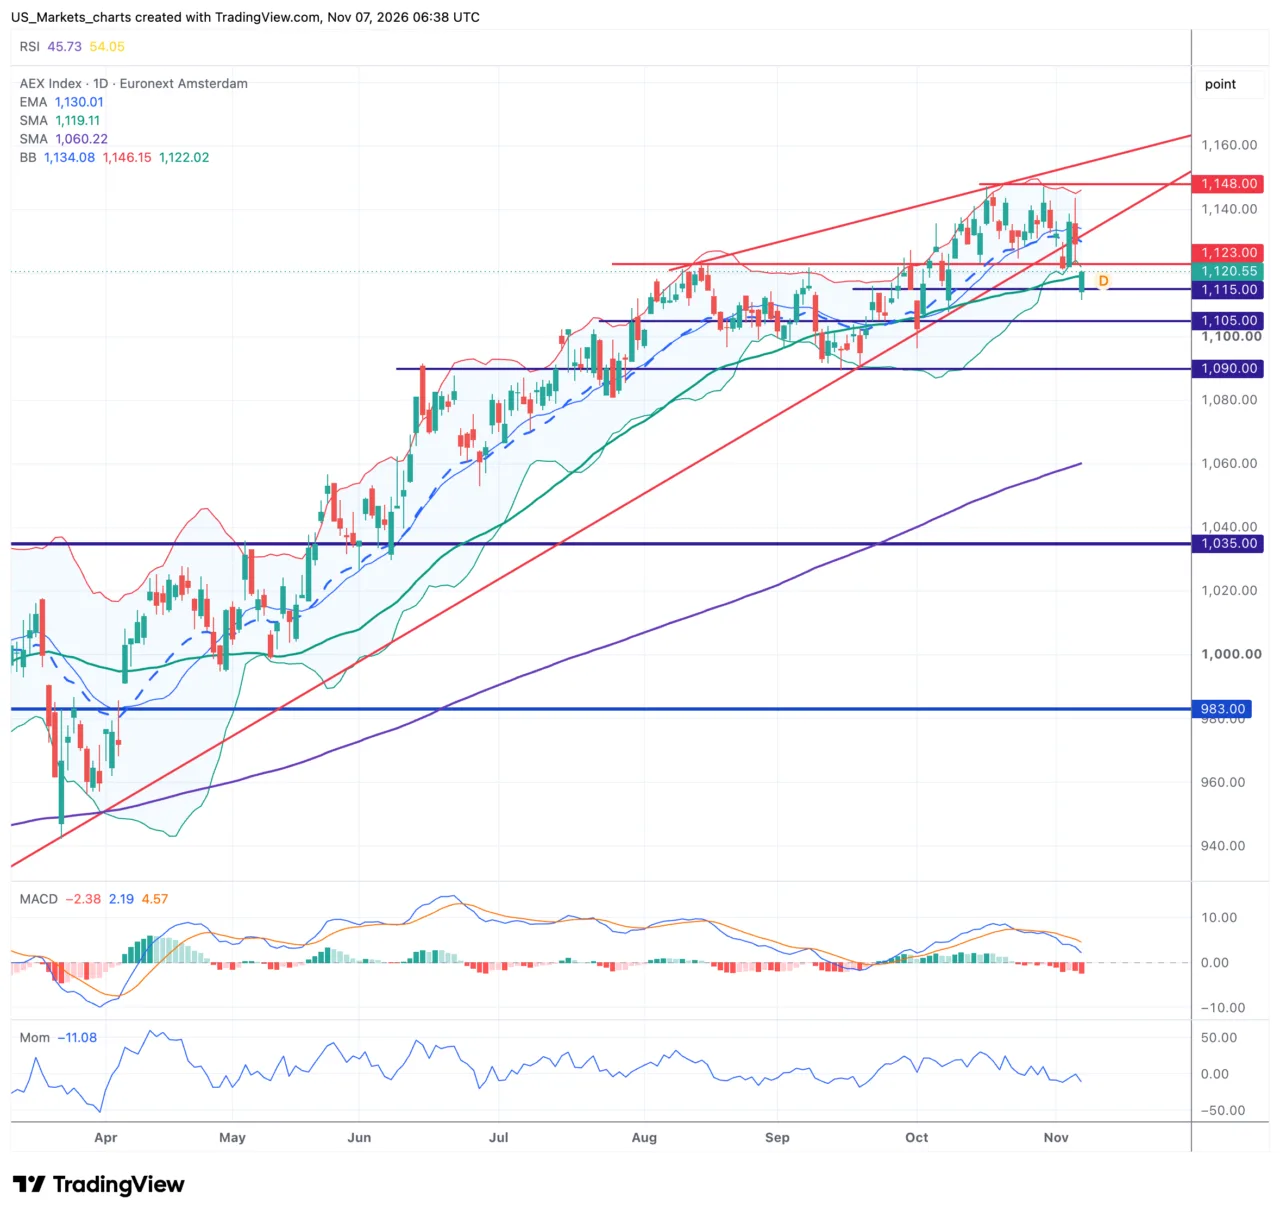
The AEX closed on Friday at 1,120.6 points, after a session between a high of 1,120.8 and a low of 1,111.7. The index trades just below the EMA-20, which comes in at 1,130, and is only just holding the SMA-50, which comes in at 1,119, as support. The SMA-200, which comes in at 1,060, remains far below the price and thereby confirms the longer rising trend. The lower Bollinger Band lies just above the closing price, a sign that the decline of the past days has already been stretched considerably.
Click the chart to view it in full size.
In short. The SMA-200 is still well below the price, so the longer trend remains rising
The RSI is at 46, neutral, so there is still room in both directions
The price does not get above the EMA-20 and drops back after a test of that line
The MACD fell below the signal line and the momentum is negative.
The AEX stays in a rising trend on the daily chart, with the SMA-200 still well below the price. In the shorter term the index is going through a correction within that trend, with the price having tested the SMA-50 as support after the decline of the past days. A clear chart pattern cannot be recognized now, the price mainly moves sideways around that average.
For the coming sessions a rebound from the support at the SMA-50 is the obvious scenario, with 1,112 as the next support in case of a further decline. A return above the EMA-20 at 1,124 and 1,130 would ease the pressure. If the price closes below 1,090, the SMA-200 comes further into view as a safety net.
|
|
Technical view Nasdaq 100
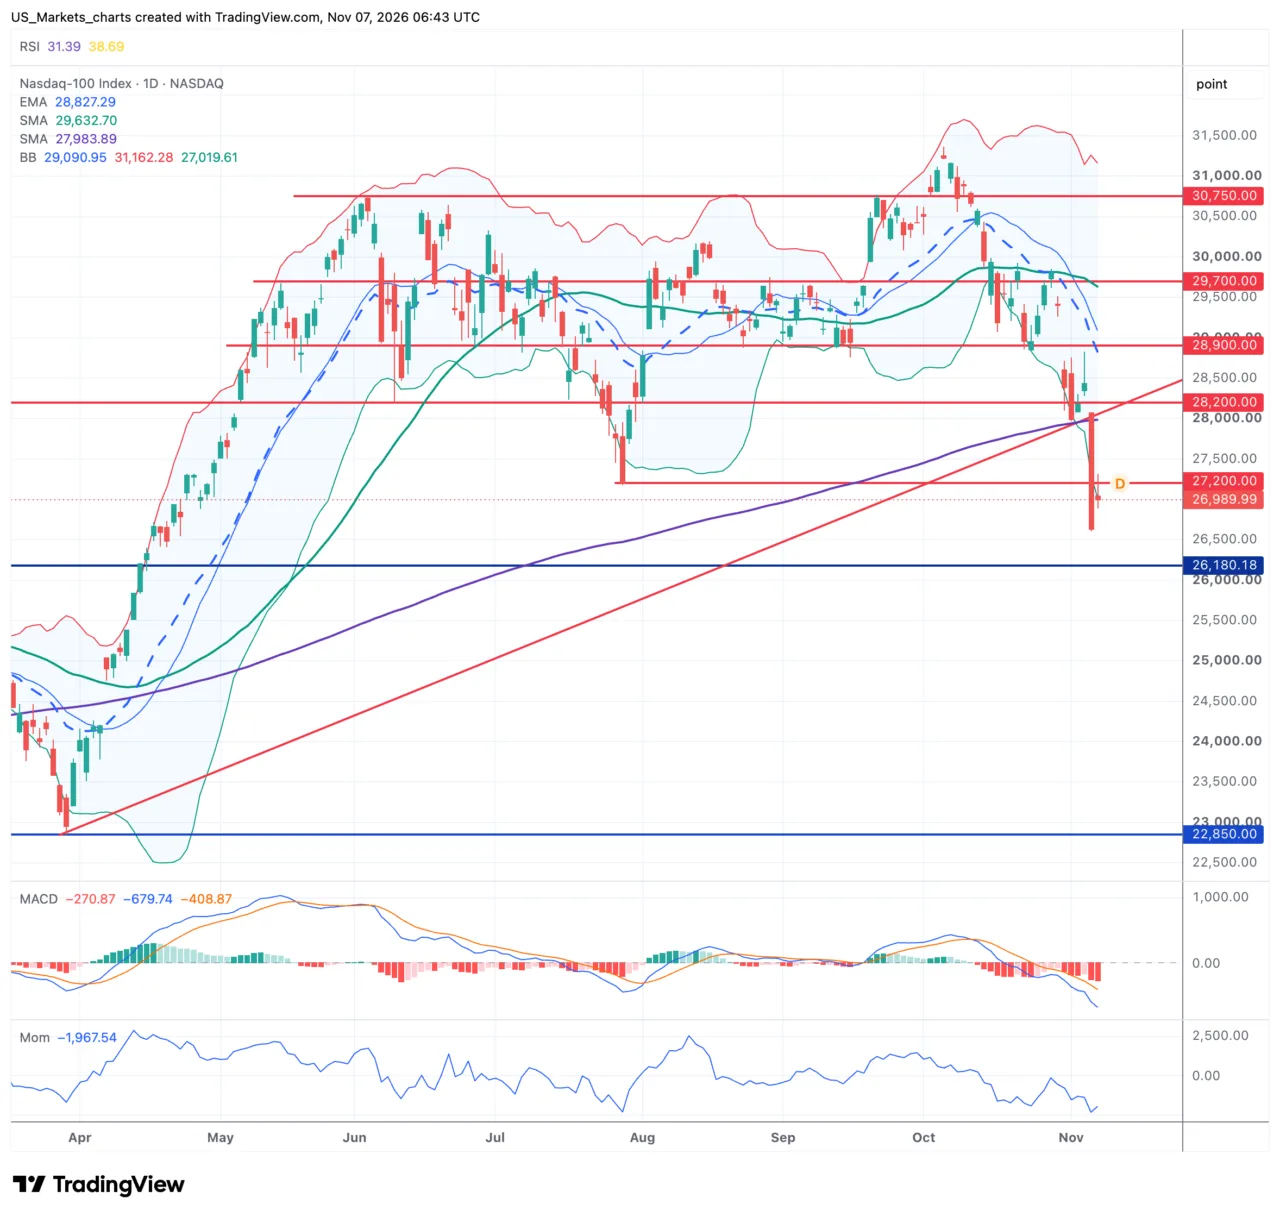
The Nasdaq 100 closed on Friday at 26,990 points, after a session between 27,316 and 26,888 points. The index therefore trades below the SMA-200, which comes in at 27,984, the signal of an official correction. The EMA-20, which comes in at 28,827, and the SMA-50, which comes in at 29,633, also lie far above the price and thus form solid overhead supply. The closing price lies just below the lower Bollinger Band, a rare, strongly stretched condition.
Click the chart to view it in full size.
In short. The RSI is at 31, deep in oversold territory, which increases the chance of a technical reaction
On Friday the index gained 1.35%, a first sign of recovery after the heavy week
The price does not get above the SMA-200 and therefore stays technically in correction
The MACD and the momentum remain clearly negative
The Nasdaq 100 has been in a technical correction since last week, with the price below the SMA-200 and a clear downward direction in the shorter term. There is no sharply defined chart pattern, the move looks mainly like a fast, volatile decline.
For the coming sessions a technical rebound is the obvious scenario, given the deeply oversold indicators, although that changes nothing about the correction in the longer trend. The price may then move back toward the SMA-200 at 27,984, which from now on acts as resistance. A close below 26,888 would weaken the picture further.
|
|
Technical view S&P 500
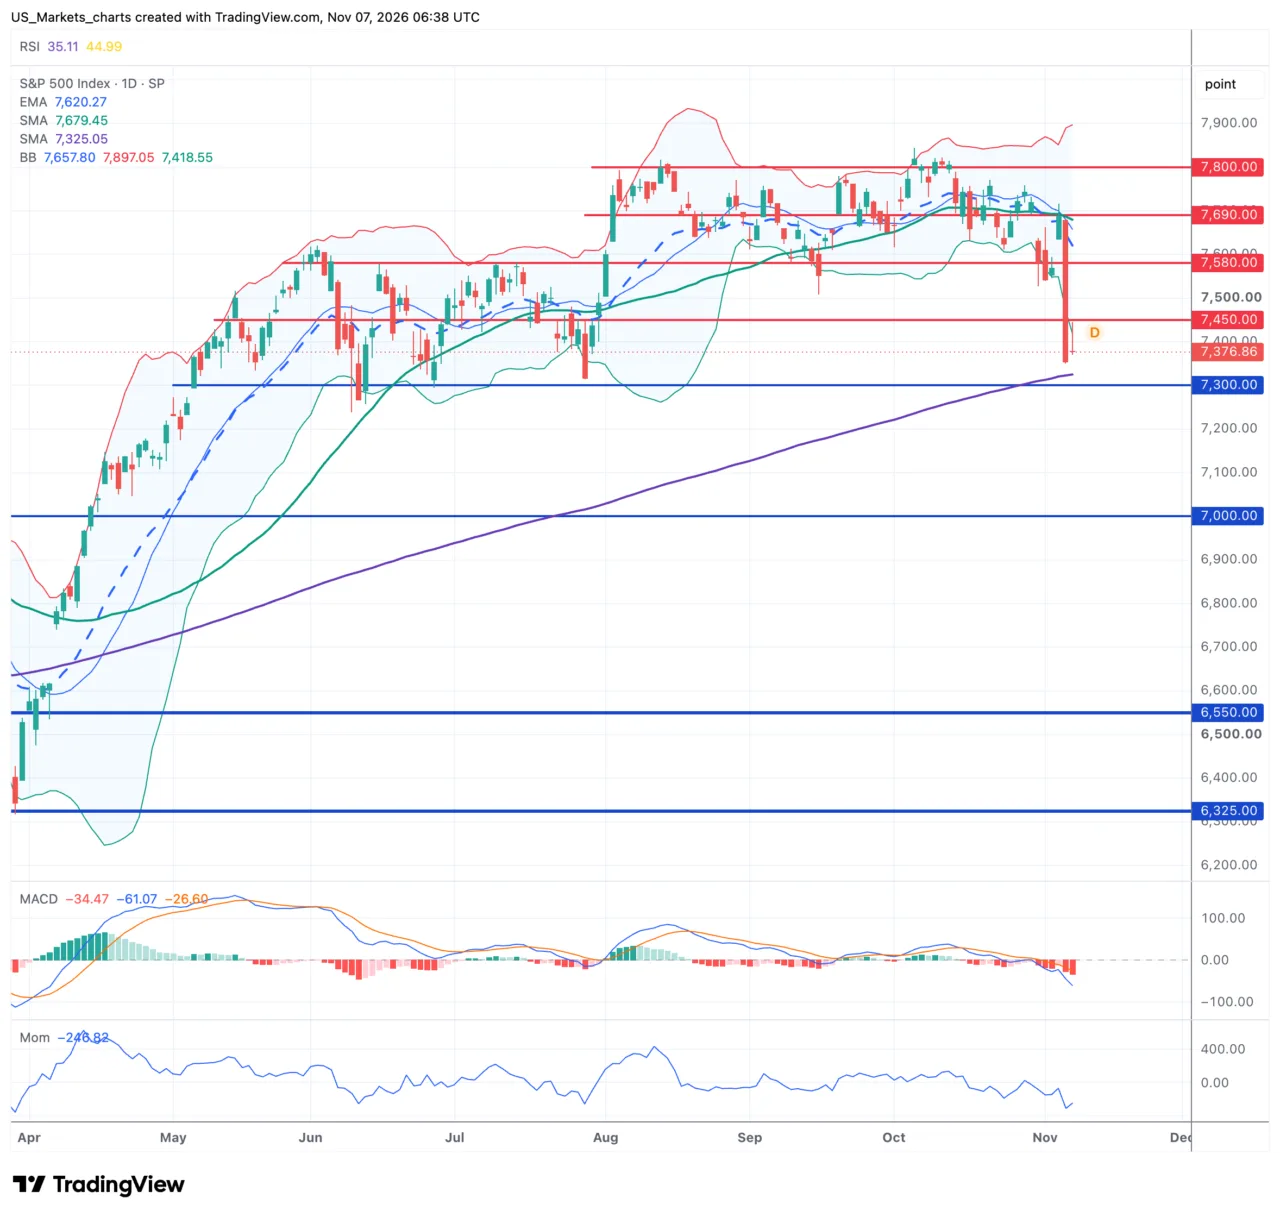
The S&P 500 closed on Friday at 7,377 points, after a session between 7,444 and 7,370 points. The index still trades just above the SMA-200, which comes in at 7,325, but below the EMA-20, which comes in at 7,620, and the SMA-50, which comes in at 7,679. The closing price lies just below the lower Bollinger Band, which points to a strongly stretched, oversold move.
Click the chart to view it in full size.
In short. The SMA-200 is only just holding as support, so the longer trend only just stays intact
The RSI is at 35, heading toward oversold, the chance of a technical reaction is now growing
The EMA-20 and the SMA-50 now act as heavy resistance
The MACD is below the signal line and the momentum remains negative.
The S&P 500 still trades above the SMA-200 and so the longer trend only just remains standing, although the direction in the shorter term is clearly corrective. No sharply defined pattern can be recognized, the index mainly moves in a wide, volatile band.
For the coming sessions a test of the support at the SMA-200 around 7,325 is the obvious scenario. A rebound from that support would ease the picture, while a close below 7,325 clears the way toward 7,200. Only a return above the cluster at 7,620 would take away most of the pressure.
|
Risk warning: this update is not investment advice. All information in this update was checked as well as possible, but much is nowadays generated with the help of AI, so some mistakes may still be present. Past results offer no guarantee for the future.
Sources: TradingView, Investing.com, Yahoo Finance, MarketWatch, usmarkets.nl.
US Markets Editorial | www.usmarkets.nl
|
|