|
US MARKETS NEWSLETTER
Intel cracks on outlook, Apple overtakes Nvidia by Trader Guy Saturday 31 October 2026 • Week 44 • Weekly overview The week began hopefully, with a steady climb on strong quarterly results and an interest rate decision from the Federal Reserve that came out exactly as expected. On Thursday and Friday that mood flipped, however. Alphabet lost heavily after its results and Intel had its worst trading day since 1974, after the chipmaker reported a strong 3rd quarter but guided for 4th quarter revenue far below analyst expectations. The stock lost 28.58% in 1 session and dragged the entire chip sector down with it, with the Philadelphia Semiconductor Index giving up 7.20%, its sharpest daily drop since early June.
Fear over the heavy spending on AI infrastructure, which had already hit Meta Platforms earlier, spread to Amazon this week and returned with full force at Alphabet. The latter lost 12.64% on Thursday after its results, the largest 1 day drop since its stock market debut in 2004 and good for roughly $500 billion in evaporated market value. Amid that turmoil Apple held its ground and took the title of most valuable listed company in the world from Nvidia, with a market value of $5.03 trillion against $4.93 trillion for the chip giant.
Not everywhere was the damage equally severe. While Wall Street ended the week with a net loss, the AEX and the DAX held up better, with the German index even closing 2.53% higher on a weekly basis.
01 • Closing session week 44
Intel drags the chip sector down, Europe stays afloat
Wall Street closed sharply lower on Friday, the heaviest session of an otherwise choppy week. The S&P 500 lost 1.82% and closed at 7,580 points, the Dow Jones fell 1.09% to 51,770 points and the Nasdaq Composite gave up 2.86% to 25,437 points, its biggest daily drop since early June. The Nasdaq 100 lost 3.46% to 28,385 points and the Philadelphia Semiconductor Index took the hardest blow with a loss of 7.20% to 10,689 points. The Russell 2000 still did relatively best with a loss of 1.66%.
On a weekly basis the picture is strongly divided. The Dow Jones and the Philadelphia Semiconductor Index limited the damage to losses of 0.85% and 0.84% respectively, while the Nasdaq Composite gave up 2%, the weakest of the 8 indices we follow, closely followed by the Nasdaq 100 with a 1.98% loss. The Russell 2000 actually finished the week with a gain of 1.29%. The fear gauge VIX rose 13% on Friday alone and ended the week at 19.41 points.
In Europe the AEX and the DAX held up better, with the AEX up 0.25% on a weekly basis and the DAX even 2.53% higher, supported by corporate results that largely bypassed the US chip sector.
The unrest built up gradually. On Wednesday the Federal Reserve, under Chair Kevin Warsh, left interest rates unchanged between 3.75% and 4.00%, with a split vote of 10 to 2, in which the 2 dissenters actually wanted a rate hike.
After the closing bell Alphabet reported revenue growth of 103% at Google Cloud, but also free cash flow that plunged deep into the red because of heavy capital expenditure, after which the stock lost 12.64% on Thursday. On Friday Intel followed with a weak outlook for the 4th quarter, despite quarterly revenue growing 21% year on year. The stock plunged 28.58% to $65.76, the heaviest daily drop for Intel since 1974, after which the company's 5 year credit default swap (CDS) also rose sharply.
| Closing levels week 44 |
| Index | Close | Friday | Week |
| S&P 500 | 7,580 | -1.82% | -0.57% |
| Dow Jones | 51,770 | -1.09% | -0.85% |
| Nasdaq Composite WEAKEST | 25,437 | -2.86% | -2.00% |
| Nasdaq 100 | 28,385 | -3.46% | -1.98% |
| Philadelphia Semiconductor | 10,689 | -7.20% | -0.84% |
| Russell 2000 | 2,812 | -1.66% | +1.29% |
| AEX | 1,134.4 | -0.68% | +0.25% |
| DAX STRONGEST | 25,818 | -0.85% | +2.53% |
Trader Guy's view
Friday was a heavy day on the stock markets, especially for the technology sectors on Wall Street. The Nasdaq 100 lost more than 1,000 points and the SOX also took heavy blows with a loss of 7.2%. This time the Dow Jones and the S&P 500 could not escape the decline either.
It is a bit what I have been saying for a while. The financing in the AI sector remains too high, and one day it will have to be paid back. At a certain moment you notice that investors start to become afraid of that. We actually saw this about 2 weeks ago, when the yield on government bonds fell back from well above 5% to below that level. Government bonds were completely ignored at the time, and investors chose instead bonds that had to finance the cash hunger of AI and chip companies. That is when a light went on for me: how are those companies going to earn that money back fast enough, and is financing with such a high risk really responsible? At moments like that we see right away how quickly investors can change their minds. At some point the switch was made in the opposite direction again, from financing towards AI to government bonds, and that was why the yield started falling so quickly again. Striking was also that the yield on AI bonds rose sharply, at CoreWeave even to above 15%.
It is a line of thinking I have been sharing for a while through my trader's diary, or mostly through my updates, because I had indicated long ago that we had to be careful with this. During this period I deliberately did not take any big risks yet, but through a number of positions that worked out well we still stand at a solid score for this year with our signals.
Unfortunately I could not catch the maximum decline, because there were too many uncertainties hanging over the market, such as the Fed this week, but also results we had no view on yet from Alphabet, Microsoft, Amazon and Intel. On top of that the PCE inflation figures came this week, which can be important for the interest rate path.
At the start of next week there is also quite a lot on the agenda that can be important. On Monday Apple and Palantir report quarterly results, among others, and on Tuesday the US midterm elections follow, which could also add fuel to the fire, in whichever direction. In the coming week I will have to consider very carefully what, where and when something can be done. We work step by step and try to limit the risks in a phase like this, and afterwards we still have plenty of time to go along with a certain direction, even though it will again move fast, in whichever direction. After that there is also the stock market listing of Anthropic waiting on the horizon, and I am very curious what will happen around that moment.
Towards the end of the year I expect that all sorts of things can still happen and that we will be able to react to them with positions. The year has gone more than well so far, which both I and the members are very pleased with. It is a year in which, if you are not careful, you can get burned, and we managed to avoid that. That is mainly thanks to the calm and composure we radiate, using my experience in the financial markets and the ability to keep the psychology that is needed for it well under control. That is how we arrive at a nice series of results in a stock market year in which many have been through the wringer.
For the coming period, in which quite a lot is heading our way 'in both directions', this now seems an optimal chance to follow along for 2 months through the trial subscription and see how we approach the markets and what we can do. Sign up as a member right away until 1 January for €29.
02 • Market themes week 44
4 themes of the week
Intel's blackest session since 1974, strong quarter buried by the weak outlook Stock down 28.58% to $65.76 • Q3 revenue up 21% year on year • Q4 outlook well below expectations • 5 year CDS spread jumped sharply Intel reported 3rd quarter revenue of $16.51 billion, growth of 21% year on year, and adjusted earnings per share of $0.52, above analyst expectations. Yet the stock lost 28.58% on Friday to $65.76, the heaviest daily drop since 1974. The cause lay in the outlook. For the 4th quarter Intel is aiming for revenue between $15 billion and $16 billion, far below the $17.07 billion analysts had expected. Revenue from PCs and physical AI fell 5% year on year to $8.1 billion, and the company warned of a net outflow of cash this year.
The shock spread to the rest of the chip sector. Applied Materials and Lam Research both lost about 5%, and the 5 year credit default swap (CDS) of Intel rose by 17.5 basis points to a record level of 124.75 basis points, possibly the largest 1 day increase since October 2022. A striking detail: the share price did not react to the figures themselves, which after all came in better than expected, but almost exclusively to the outlook for the coming months. Apple dethrones Nvidia as the world's most valuable company Apple now at $5.03 trillion in market value, above Nvidia at $4.93 trillion Amid all the unrest around chips and AI spending, Apple took the title of most valuable listed company in the world from Nvidia on Friday, for the first time since late July. The market value of Apple rose to $5.03 trillion, against $4.93 trillion for Nvidia, which gave up 4.22% on Friday. Apple itself is up 27% this year, while Nvidia lost more than 10% over the past month.
Analysts mainly point to the relative restraint of Apple in its own infrastructure spending, combined with solid free cash flow, as the explanation for the relative calm around the stock. That stands in sharp contrast to the unrest at the companies that are investing heavily in AI data centers, which the market began to view ever more critically this week. Amazon and Alphabet post fine results, but free cash flow keeps minds busy Amazon 2026 capex stays at $220 billion • Alphabet down 12.64% on Thursday, biggest fall since its 2004 debut • hyperscalers together spent over $200 billion on capital expenditure Amazon reported revenue and earnings per share on Thursday that both missed analyst expectations, with slowing growth in retail and advertising. The company kept its 2026 capex forecast at $220 billion, announcing that spending will rise further next year. The stock closed only 1.41% lower on Friday at $240.35, after having been down as much as 6.3% in premarket trading, a relatively resilient reaction.
Alphabet had a much harder time on Thursday. Despite revenue growth of 103% at Google Cloud, free cash flow fell deep into the red, and the stock lost 12.64%, the largest 1 day drop since its stock market debut in 2004 and good for roughly $500 billion in evaporated market value, the 2nd largest 1 day destruction of value in US stock market history after the record of Nvidia in January 2025.
According to Swissquote strategist Ipek Ozkardeskaya, Amazon, Alphabet, Microsoft and Meta Platforms together already spent more than $200 billion this quarter, with the risk that higher financing costs eat up an ever larger part of the cash flow generated. Meta Platforms itself announced a financing plan through shares of nearly $100 billion. Europe escapes the American malaise DAX up 2.53% on a weekly basis • AEX up 0.25% • Nasdaq Composite down 2% While American technology and chip names pulled the broad indices down, the European markets held up remarkably well. The DAX closed the week 2.53% higher, the strongest of the indices we follow, and the AEX, with a gain of 0.25%, even managed to hold on to a 7th week in a row of gains or a virtually flat reading. Both indices thus largely stayed out of the line of fire of the unrest around American AI spending.
The pattern underlines how concentrated the current unrest is. It is not the broader economy that is under discussion, but specifically the confidence in the returns on the billions that a handful of American tech giants are pouring into AI infrastructure. As long as that confidence erodes, it stands to reason that investors react hardest where the exposure to those names is greatest, and that is mainly the Nasdaq and the SOX. 03 • Company news
What else stood out
Meta Platforms announced a large financing plan this week through shares, up to $97.5 billion, intended to keep funding its own AI data centers without burdening the balance sheet further with debt. It fits a broader pattern in which the big technology companies are becoming ever more creative in financing their capital expenditure, something investors began to look at more critically this week.
Anthropic, the maker of Claude and by now one of the bigger names in generative AI, announced that it is preparing the step to a stock market listing. An official filing has not yet been submitted, but the announcement underlines how quickly the AI sector is moving towards the public markets, even while existing AI related stocks were under heavy pressure this week.
On the commodities market the move in precious metals was striking. Gold lost 3.61% on Friday to $3,885.19 and silver even 6.2% to $49.1, a sharp correction. A combination of profit taking and a slightly harder stance from the Federal Reserve after this week's meeting is cited as the main explanation.
Trial subscription • Guy Systeem Trading
Try now for €29 • UNTIL 1 JANUARY
You get trading plans, concrete signals by SMS and email, access to the 'Dynamische Aandelen Portefeuille' (Dynamic Stock Portfolio) and the 'ETF strategie' (ETF strategy).
Every morning 2 updates and access to our private members forum.
Now a trial subscription until 1 January for €29
Our numbers speak for themselves. Below is the monthly overview of the signals Guy Systeem Trading has sent since November 2025.
| Month | Result |
| November 2025 | +€3,801 |
| December 2025 | +€1,204 |
| January 2026 | +€151 |
| February 2026 | +€3,202 |
| March 2026 | +€2,197 |
| April 2026 | -€940 |
| May 2026 | +€1,268 |
| June 2026 | +€601 |
| July 2026 | +€837 |
| August 2026 | +€931 |
| September 2026 | +€896 |
| October 2026 (interim position up to 30/10) | +€1,506 |
| Total (November 2025 to October 2026) | +€15,654 |
Sum of the past 12 months: €15,654 result, with 11 of the 12 months (92%) in the plus. November 2025 was the outlier with +€3,801, April 2026 was the most difficult month at -€940.
Past performance offers no guarantee for the future. Figures updated up to and including 30 October 2026, the interim position of October, the most recent position available.
Trial subscription • Polleke Trading
Try now for €39 • UNTIL 1 JANUARY
Every morning you get a ready made premarket email with concrete entry and exit levels, price targets and stop loss levels from Paul (Polleke), at least 2 video blogs per week, daily updates and signals by email, mainly aimed at the AEX and the DAX and using turbos or boosters.
Now a trial subscription until 1 January for €39
Suitable for beginners thanks to the simple setup, and for experienced traders as a full trading plan alongside Guy Systeem Trading.
04 • Technical analysis
5 charts, the chip damage in view
An overview of 5 charts that we briefly analyze on a technical basis. The technology indices in particular suffered a heavy decline over the past 2 sessions. The market seems to be positioning itself for the midterm elections next Tuesday. Everything indicates that we are heading for an extremely volatile week next week.
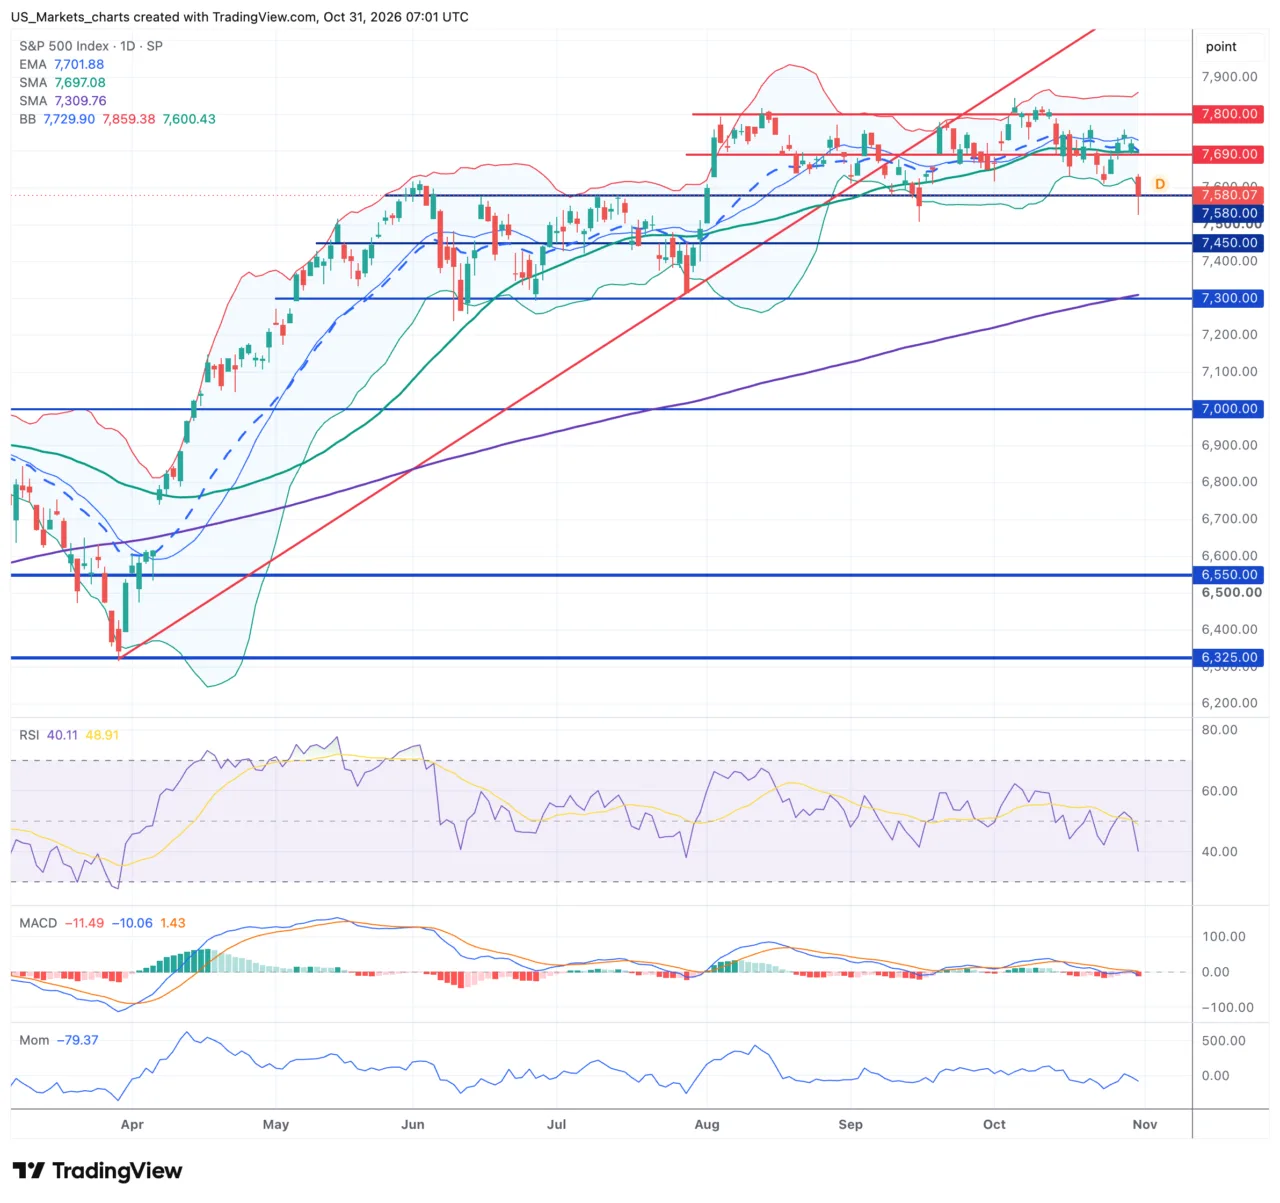
S&P 500 SPX 7,580 • support put to the test, trendline broken
Click the chart to view it at full size.
The S&P 500 closed the week sharply lower at 7,580 points, a drop of 1.82% on Friday and 0.57% on a weekly basis, exactly on the support line at 7,580. The rising trendline since April was already broken, and the index immediately fell through the former support at 7,690, which has now become resistance. The next support can now be expected at 7,450. The EMA-20 stands at 7,702, the SMA-50 at 7,697, both just above the price, while the SMA-200 at 7,310 still keeps the longer term trend upright.
In short- The rising trendline since April was already broken.
- Price falls below the EMA-20 and the SMA-50, the picture is strongly weakened.
- Price still well above the SMA-200, the long term trend is still positive.
- The RSI falls towards 40, MACD and momentum both point down.
After months of relative calm the Bollinger Bands widened abruptly to the downside on Friday, a sign that volatility jumped in one go after the price touched the lower band, usually a signal that a decline is going too fast in the short term and calls for a pause. The pattern of the broken trendline is confirmed, now that the price closed below it with a heavy red candle.
The longer trend remains upward as long as the SMA-200 at 7,310 holds, but for the coming sessions a further test of the support at 7,450 is the obvious expectation. A close below that level would deepen the correction further, while a quick recovery above 7,690 could undo this week's damage.
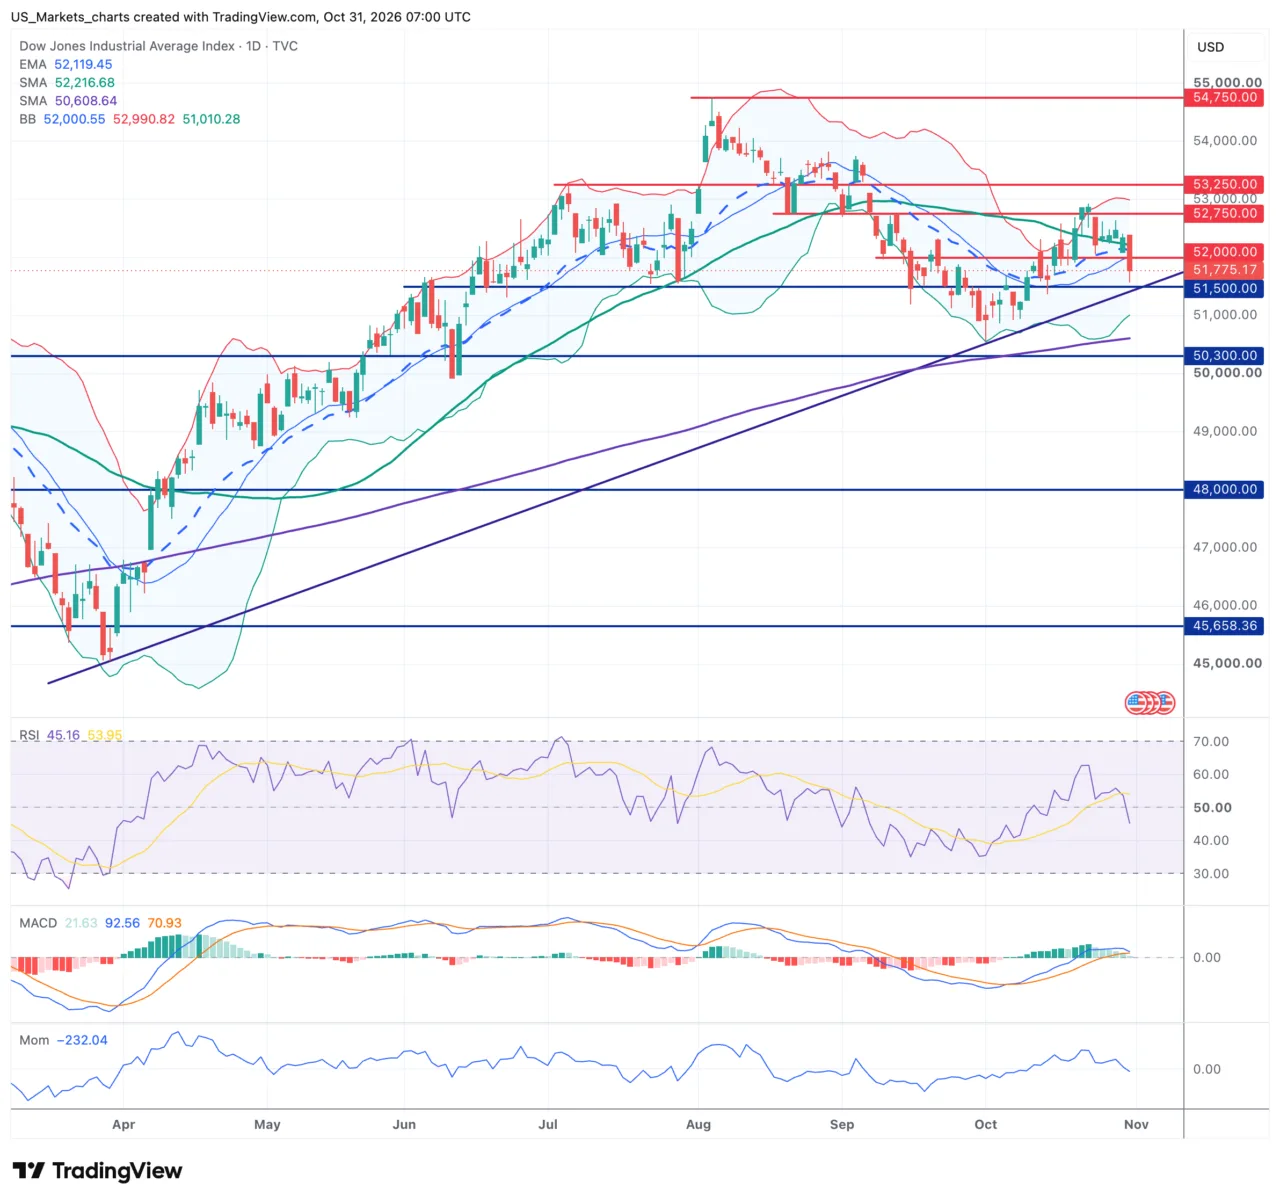
Dow Jones DJI 51,770 • support at 51,500 still holds
Click the chart to view it at full size.
The Dow Jones closed the week at 51,770 points, 1.09% lower on Friday but only 0.85% lower on a weekly basis, the smallest weekly loss of the indices on Wall Street. The EMA-20 at 52,119 and the SMA-50 at 52,217 lie just above the price, the SMA-200 at 50,609 remains far below. The support at 51,500 held again this week.
In short- Price remains well above the SMA-200, the longer trend remains firmly upward.
- The support at 51,500 held again this week.
- Price fell back below the EMA-20 and the SMA-50 on Friday.
- The Dow was the most stable of the indices on Wall Street this week.
The Bollinger Bands stayed relatively narrow this week, a sign that the Dow reacted far less violently to the unrest than the tech heavy indices, although the band also widened slightly to the downside on Friday. The trading range between 51,500 and 52,750 remains intact, a breakout is not yet visible.
For the coming sessions a renewed test of the resistance at 52,750 is the most obvious, as long as the support at 51,500 holds. A close below that level would break the range to the downside and bring the support at 50,300 into view.
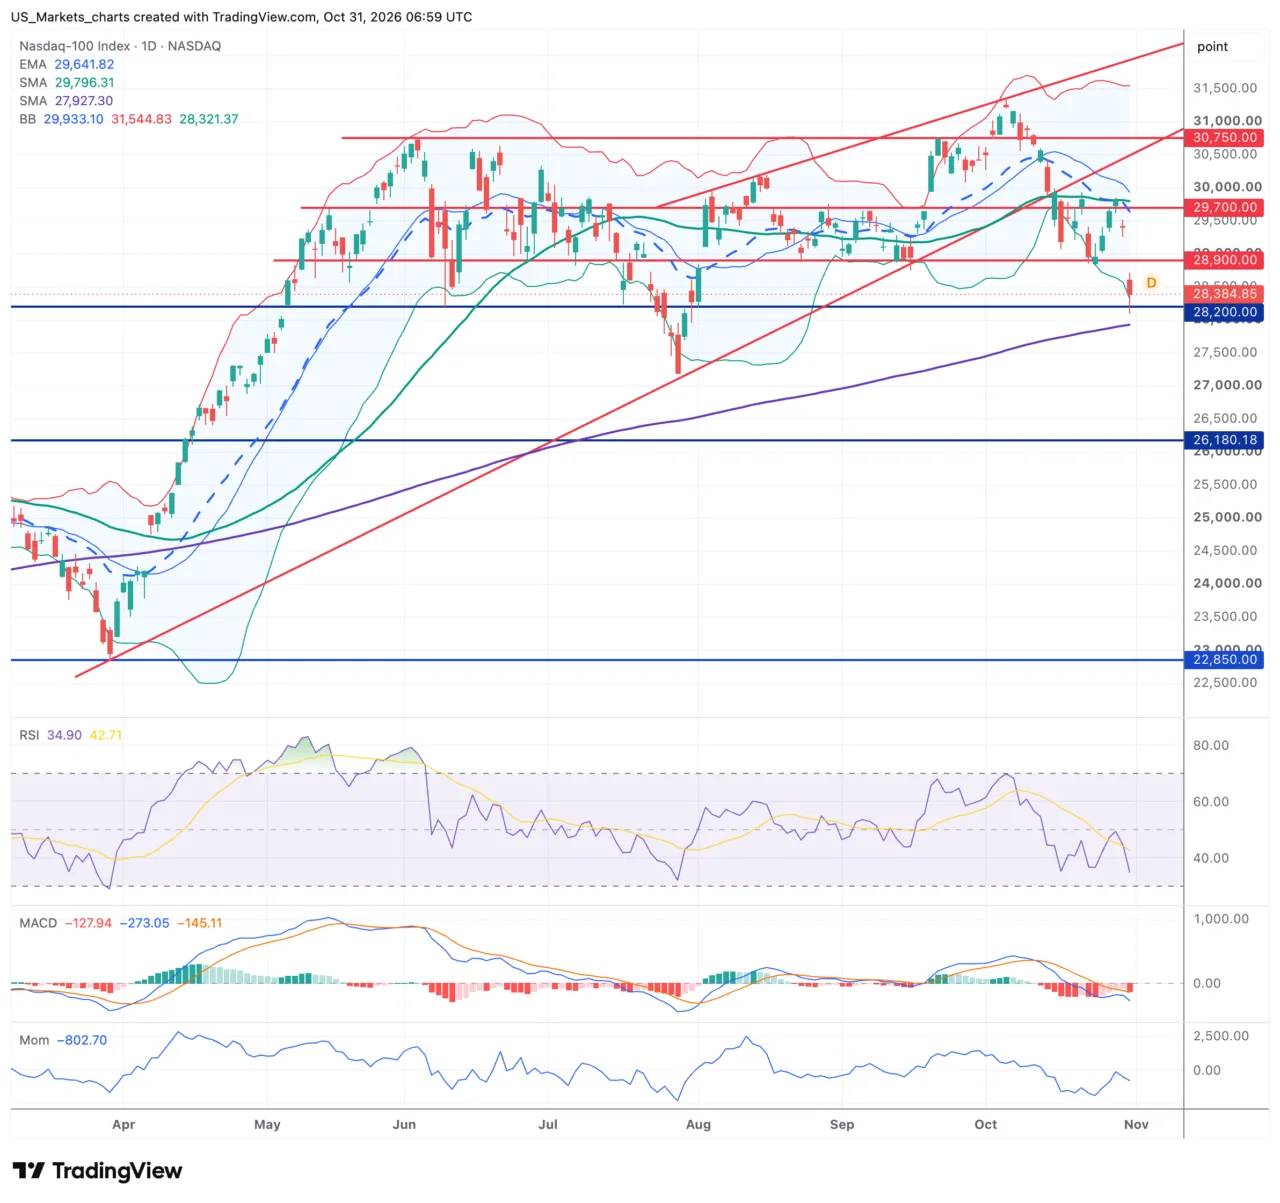
Nasdaq 100 NDX 28,385 • support at 28,200 in sight after trendline break
Click the chart to view it at full size.
The Nasdaq 100 closed the week at 28,385 points, a fall of 3.46% on Friday and 1.98% on a weekly basis, the heaviest weekly decline among the 5 indices discussed today. The rising trendline since April was broken this week and the index fell below the former support at 29,700, which now becomes resistance. The EMA-20 at 29,642 and the SMA-50 at 29,796 lie well above the price, the SMA-200 at 27,927 just about keeps the longer term trend upright.
In short- The rising trendline since April was broken, and confirmed.
- Price is below the EMA-20 and the SMA-50, the picture is considerably weakened.
- Price stays just above the SMA-200, the longer term trend just about holds.
- The RSI towards 35, close to oversold, MACD and momentum weaken.
The Bollinger Bands widened sharply to the downside on Thursday and Friday, the clearest volatility signal of the 5 charts this week, after Alphabet and Intel hit the tech heavy Nasdaq 100 the hardest. The status of the trendline break is confirmed, a bottom is not yet in sight.
For the coming sessions a further test of the support at 28,200 is the obvious expectation. A close below it opens the way towards 26,180, while a quick recovery above 29,700 could undo this week's weakening.
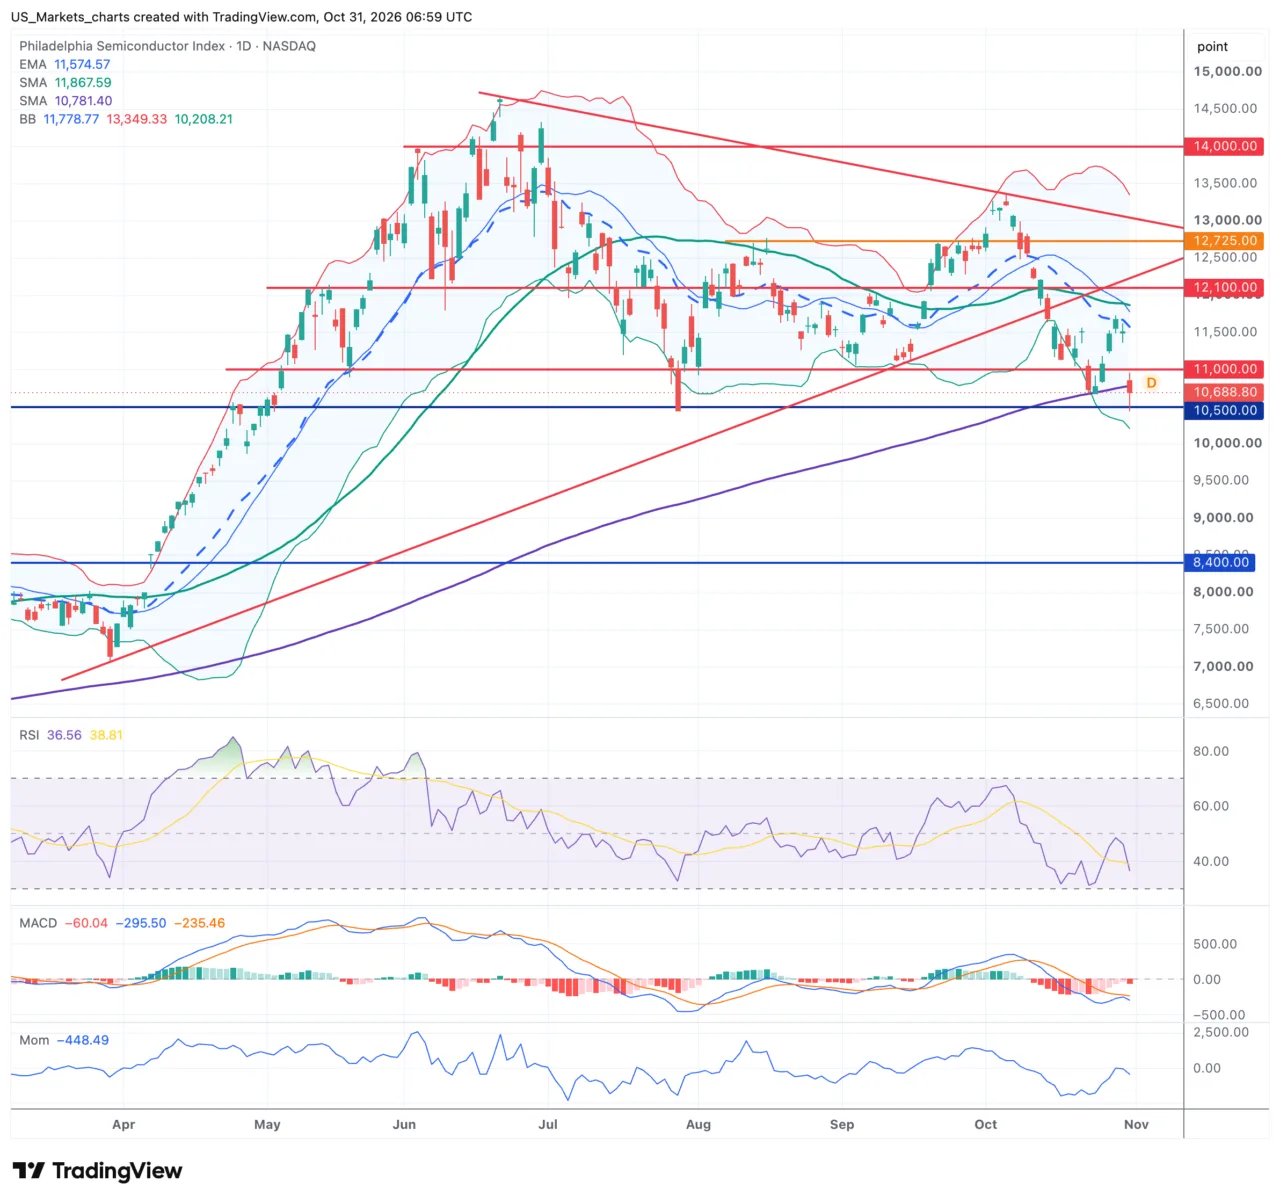
Semiconductor index SOX 10,689 • support at 10,500
Click the chart to view it at full size.
The Philadelphia Semiconductor Index closed on Friday at 10,689 points, a fall of 7.20% on the day of the Intel shock and 0.84% on a weekly basis and more than 15% on a monthly basis. The price fell well through the support at 11,000, which earlier this year served several times as support and resistance and has now become resistance. The EMA-20 at 11,575 and the SMA-50 at 11,868 lie well above the price, the SMA-200 at 10,781 has meanwhile also been broken.
In short- Intel dragged the entire chip sector along, the index lost 7.20% on Friday.
- Price falls firmly below the EMA-20 and the SMA-50 and now also below the SMA-200.
- Price stays close to the SMA-200, the longer term trend is under pressure.
- The RSI falls towards 37, MACD and momentum both point down.
The Bollinger Bands shot wide open on Friday after weeks of a relatively narrow bandwidth, the sharpest volatility signal of all 5 charts, on exactly the day Intel caused the worst trading day since 1974. The break through the support at 11,000 is confirmed.
For the coming sessions a test of the support at 10,500 is the obvious expectation, just below the current price. A close below it would deepen the damage further below the SMA-200, while a quick recovery above 11,000 would temper the panic of Friday.
“Only when the tide goes out do you discover who has been swimming naked.” Warren Buffett AEX AEX 1,134.4 • resistance at 1,148 still within reach
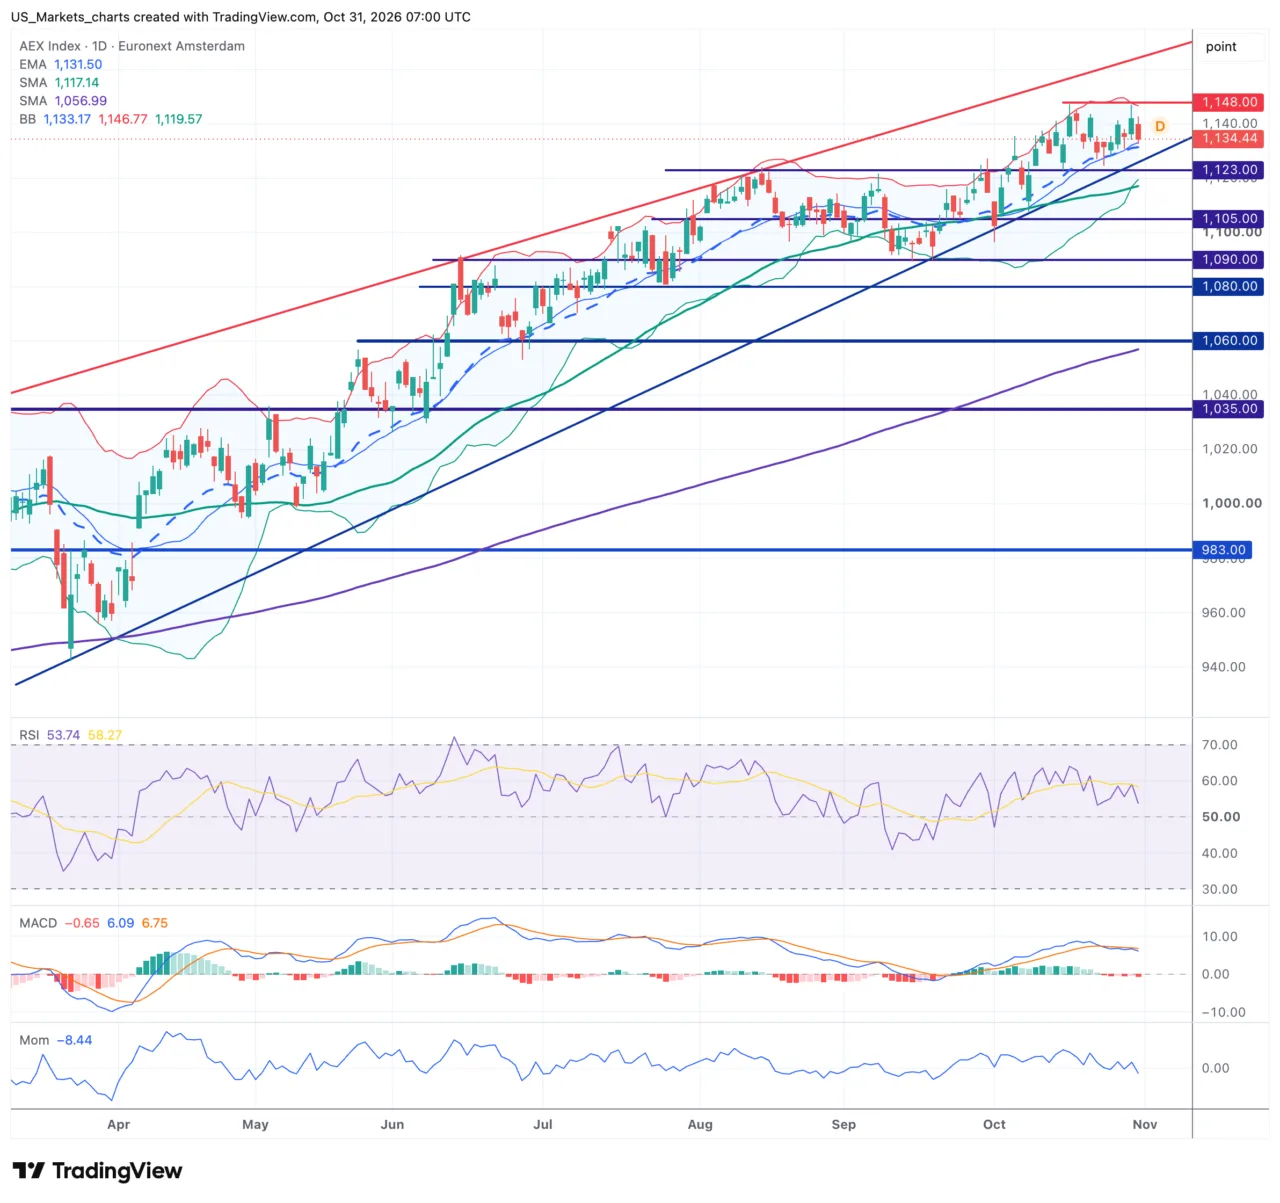
Click the chart to view it at full size.
The AEX closed the week at 1,134.4 points, 0.68% lower on Friday but 0.25% higher on a weekly basis, the 7th week in a row of gains or a virtually flat reading. The index is testing the resistance at 1,148, the highest level ever. The EMA-20 at 1,131 and the SMA-50 at 1,117 lie below the price, the SMA-200 at 1,057 underlines the firm upward trend.
In short- Price stays well above all 3 averages, the trend remains clearly upward.
- The AEX held up firmly this week against the American unrest.
- The resistance at 1,148 is still just holding for now.
- The RSI stays around 54, a healthy and neutral level without overextension.
The Bollinger Bands remain the narrowest at the AEX of the 5 charts, a sign of the relative calm with which the index let the American volatility pass this week. The upward channel since spring remains intact, status in formation towards a possible breakout above 1,148.
For the coming sessions a renewed test of the resistance at 1,148 is the obvious expectation. A close above it would make new records possible, while a fall below the EMA-20 at 1,131 could be the first serious warning. 05 • Market psychology
A strong quarter, yet the worst day since 1974
That Intel fell 28.6% on Friday despite revenue and earnings above expectations says little about the quarter itself and a lot about how investors weigh information. That is also something I often write: the market reacts more strongly to a change in the expectation for tomorrow than to the facts of today, because the brain is mainly tuned to what shifts, not to what is already known. A fine quarter was thus overshadowed within hours by a disappointing look at the next one.
Such shock moments often coincide with an accumulation of facts that all pointed the same way, after which the real damage occurs once the positions are reduced all at the same time. Research into investor behavior after negative surprises shows a similar picture: the first reaction is usually more violent than the underlying information justifies, and part of it is often reversed in the days that follow.
In my experience as a coach who, alongside technical analysis, has also learned a lot about market psychology, a day like this is above all a test of following your own rules. The question is not whether the chip sector falls further next week, but mainly how you deal with it from here. 06 • Week in numbers
Yield at 4.93%, precious metals turn sharply
The American 10 year yield ended the week at 4.93%, and the 30 year yield at 5.31%, both clearly falling back from the highest level of the past weeks, but they still remain high compared with a few months ago. That is also due to the somewhat harder tone of the Federal Reserve under Chair Kevin Warsh.
Brent oil traded around $113 per barrel. Precious metals took a heavy blow on Friday, gold lost 3.6% to $3,885 per troy ounce and silver even 6.2% to $49.1, a sizeable correction after the strong period of the past months. Bitcoin moved along with the risk aversion in the broader market, with a loss on Friday to about $77,350. 07 • Outlook week 45
Midterm elections and plenty of quarterly results
After a week dominated by Intel and the concerns about the cash flow of the big technology companies, week 45 is mainly about the American midterm elections of Tuesday 3 November and a new, somewhat smaller wave of quarterly results. Among others Apple, Palantir, AMD, Qualcomm, Uber, ARM, McDonald's and Novo Nordisk report this week.
On the macro front the week opens on Monday with the ISM Manufacturing PMI, followed by the midterm elections on Tuesday, the ADP employment report on Wednesday, the Bank of England interest rate decision on Thursday and, as the finale on Friday, the American jobs report for October, traditionally 1 of the most closely followed figures of the month.
After this week's shock in the chip sector the market will mainly look at more semiconductor companies reporting results and at Friday's jobs report, which will either confirm or soften the harder tone of the Federal Reserve.
With the 10 year yield close to 5%, the outcome of Tuesday's elections also remains a factor to keep an eye on for the budget course of the coming years.
Macro calendar • Week 45 (2 November to 8 November 2026)
Monday 2/11 ISM Manufacturing PMI US, results Apple
Tuesday 3/11 American midterm elections
Wednesday 4/11 ADP employment report US, indication for Friday
Thursday 5/11 Bank of England rate decision • ISM Services PMI US
Friday 6/11 American jobs report for October
Risk warning. Investing involves risks, you can lose all or part of your investment. This newsletter is for information purposes only and does not constitute individual investment advice.
Risk warning: Turbos and Boosters are complex instruments and, because of the leverage effect, carry a high risk of rapidly mounting losses. 7 out of 10 retail investors lose money trading Turbos. It is important that you understand how Turbos work and that you check whether you can afford the high risk of loss.
All information in this newsletter has been checked as well as possible, but parts are generated with the help of AI, so some errors may remain. Sources: Investing.com, TradingView, Yahoo Finance, MarketWatch, TheStreet.com and the own price data of USMarkets.nl.
US Markets • USMarkets.nl © 2026 USMarkets.nl • Trader Guy • For information only • No investment advice USMarkets.nl | TraderShop |
|