English translation of the Dutch original. | US Markets Editorial Team US Markets NewsletterSaturday 14 November 2026 • Week 46 • Weekly overview |
Changing of the guard in AI land by Trader Guy
After 4 losing weeks in a row, Wall Street finally booked a weekly gain again. The S&P 500 gained 2.51%, the Nasdaq 100 3.53% and the chip index SOX even 8.05%, while in Europe the DAX climbed 3.60% above the August high. On Friday the mood in technology did turn, with a sharp drop among the chip names, while the Dow Jones, the AEX and the DAX stayed more or less upright.
Still, the week was mostly about a changing of the guard. At Nvidia Jensen Huang stepped down as CEO and the stock lost almost 13% over the week. Meanwhile Anthropic is preparing for the biggest IPO of the year, with the 1st trading day on Thursday 19 November. With high inflation and a possible rate hike in December in the background, next week promises to be anything but quiet.
01 • Closing session Week 46
Chips give back ground, the Dow keeps its back straight
On Friday 13 November the entire technology corner faded after the open, while the rest of the market held up reasonably well. The S&P 500 lost 0.40% to 7,562 points and the Nasdaq Composite gave up 0.91% at 25,136 points. The Nasdaq 100 fell 1.22% to 27,944 points and the SOX even lost 3.43% to 10,146 points. The Dow Jones, by contrast, closed 0.10% higher at 52,347 points, with consumer staples and energy as the strongest sectors.
On a weekly basis the picture is far more positive, as all 10 indices in the table end the week in the green. The SOX is the strongest with a gain of 8.05%, the Russell 2000 the weakest with 1.32%. In Europe the DAX gained 3.60% on the week and the AEX 1.82%, while both ended Friday almost flat.
| Closing levels week 46 |
| Index | Close | Friday | Week |
| S&P 500 | 7,562 | -0.40% | +2.51% |
| Dow Jones | 52,348 | +0.10% | +2.07% |
| Nasdaq Composite | 25,136 | -0.91% | +2.27% |
| Nasdaq 100 | 27,944 | -1.22% | +3.53% |
| SOX STRONGEST | 10,146 | -3.43% | +8.05% |
| Russell 2000 WEAKEST | 2,790 | -0.31% | +1.32% |
| AEX | 1,141 | +0.07% | +1.82% |
| BEL 20 | 6,120 | +0.07% | +2.06% |
| CAC 40 | 8,369 | +0.09% | +2.82% |
| DAX | 26,750 | -0.08% | +3.60% |
The view of Trader Guy
It was not an easy closing session to end the week. On Friday a fairly sharp decline got going in the technology sectors after the open of Wall Street. Notably, once again only technology had that problem, because the DAX and the AEX did not follow that path, nor did the Dow Jones, which also managed to close positive.
The S&P 500 lost as well, and we were able to use that decline to close our positions on both the S&P 500 and the Nasdaq 100 with a nice profit. That brings us close to the break even point again after the poor start to this month. We now have full freedom again to patiently work out from next week which positions we can still take towards the end of the month.
Next week also brings the IPO of Anthropic, which will take place on Thursday 19 November. In the run up to it I am curious how the markets will behave, but I am also very curious what will happen once that IPO is completed and there is a stock market listing.
There has been no shortage of volatility in recent weeks. I also see no reason why that will change soon. That is why there are still plenty of opportunities towards the end of this year.
I want to continue the year of trading that has gone well so far. Become a member now until 1 January for only €15 via this special offer.
To add, what counts next week
According to the prospectus, the price of Anthropic will be set on the evening of Wednesday 18 November, after which the stock starts on the Nasdaq under the ticker ANT on Thursday 19 November. The price range is between $70 and $78 per share, good for around $61 billion in new shares.
Before that, Nvidia reports quarterly results after the close on Tuesday 17 November, the 1st time without Jensen Huang at the helm. In addition, the market is pricing in a rate hike by the Fed in December, after an inflation figure that came in higher than expected this week.
02 • Market themes Week 46
4 themes of the weekNvidia without Jensen Huang
The news of the week came on Thursday 12 November, when Jensen Huang stepped down after more than 30 years as head of Nvidia. Colette Kress, until now chief financial officer, takes over the helm. Investors reacted nervously, the stock lost another 2% or so on Friday to $162.85 and gave up almost 13% over the whole week.
HSBC cut its rating to hold, and the rest of the AI chain also took hits on Friday. Notably, the chip index SOX still ended the week with a big gain, so the problem lies mainly with Nvidia itself and not with the whole sector. Inflation keeps the Fed on edge
The US CPI of Tuesday 10 November came in higher than expected and pushed the 10 year yield towards 5.15%. Fed governor Christopher Waller said he supports a rate hike in December, and even wants to see a step of half a percentage point if inflation accelerates further.
Producer prices for October came in a bit cooler on a monthly basis, but on a yearly basis the increase remains high. The market therefore factors in a large chance of a rate hike in December by the Fed under chair Kevin Warsh. A higher rate makes borrowing more expensive for precisely the fast growing technology companies. 1st weekly gain in 5 weeks
After 4 losing weeks in a row, Wall Street recovered strongly this week from the chip shock of early November. The S&P 500 gained 2.51%, the Dow Jones 2.07% and the Nasdaq Composite 2.27%, the best Nasdaq week since August.
European markets took part in full. The DAX climbed 3.60% and now trades above the August high, the CAC 40 gained 2.82% and the AEX and the BEL 20 also ended the week with a gain. Countdown to Anthropic
Since Monday 10 November Anthropic has been touring large investors for the IPO on the Nasdaq Global Select Market. The company wants to sell 825 million shares at $70 to $78 each, in addition to a private placement of $26 billion.
Such a large IPO draws money away from other AI names, because funds often first free up room in order to get in. That can cause extra movement in the technology corner in the run up to Thursday 19 November.
03 • Company news
What else stood out
Friday was mainly a heavy day for the chip names. AMD dropped 8.75% to $534.06 and Broadcom and CoreWeave also fell sharply, causing the technology sector as a whole to lose 1.7%.
Investors sought out the safe corner. Consumer staples gained 1.39% and energy 0.96%, the typical sectors where money flows once growth stocks wobble.
Trial subscription • Guy Systeem Trading
Try it now for €15 until 1 January 2027
Clear trading signals on indices, stocks and ETFs, both LONG and SHORT, with concrete entry zones, price targets and stops per position.
This week we closed the positions on the S&P 500 and the Nasdaq 100 with a profit, and with the Anthropic IPO and the Nvidia results coming up, there are certainly new opportunities ready.
Sign up now
Sign up via https://www.usmarkets.nl/tradershop
| Results Guy Systeem Trading |
| Month | Result |
| November 2025 | €3,801 |
| December 2025 | €1,204 |
| January 2026 | €151 |
| February 2026 | €3,202 |
| March 2026 | €2,197 |
| April 2026 | -€940 |
| May 2026 | €1,268 |
| June 2026 | €601 |
| July 2026 | €837 |
| August 2026 | €931 |
| September 2026 | €896 |
| October 2026 | €1,506 |
| November 2026 (interim result 13 November) | -€80 |
| Total up to and including the November 2026 interim result | €15,574 |
Results are an indication based on closed positions, no guarantee for the future.
04 • Technical analysis
4 charts, Europe strong and tech hits the brakes
| S&P 500 Index SPX | FRIDAY -0.40%
WEEK +2.51% |
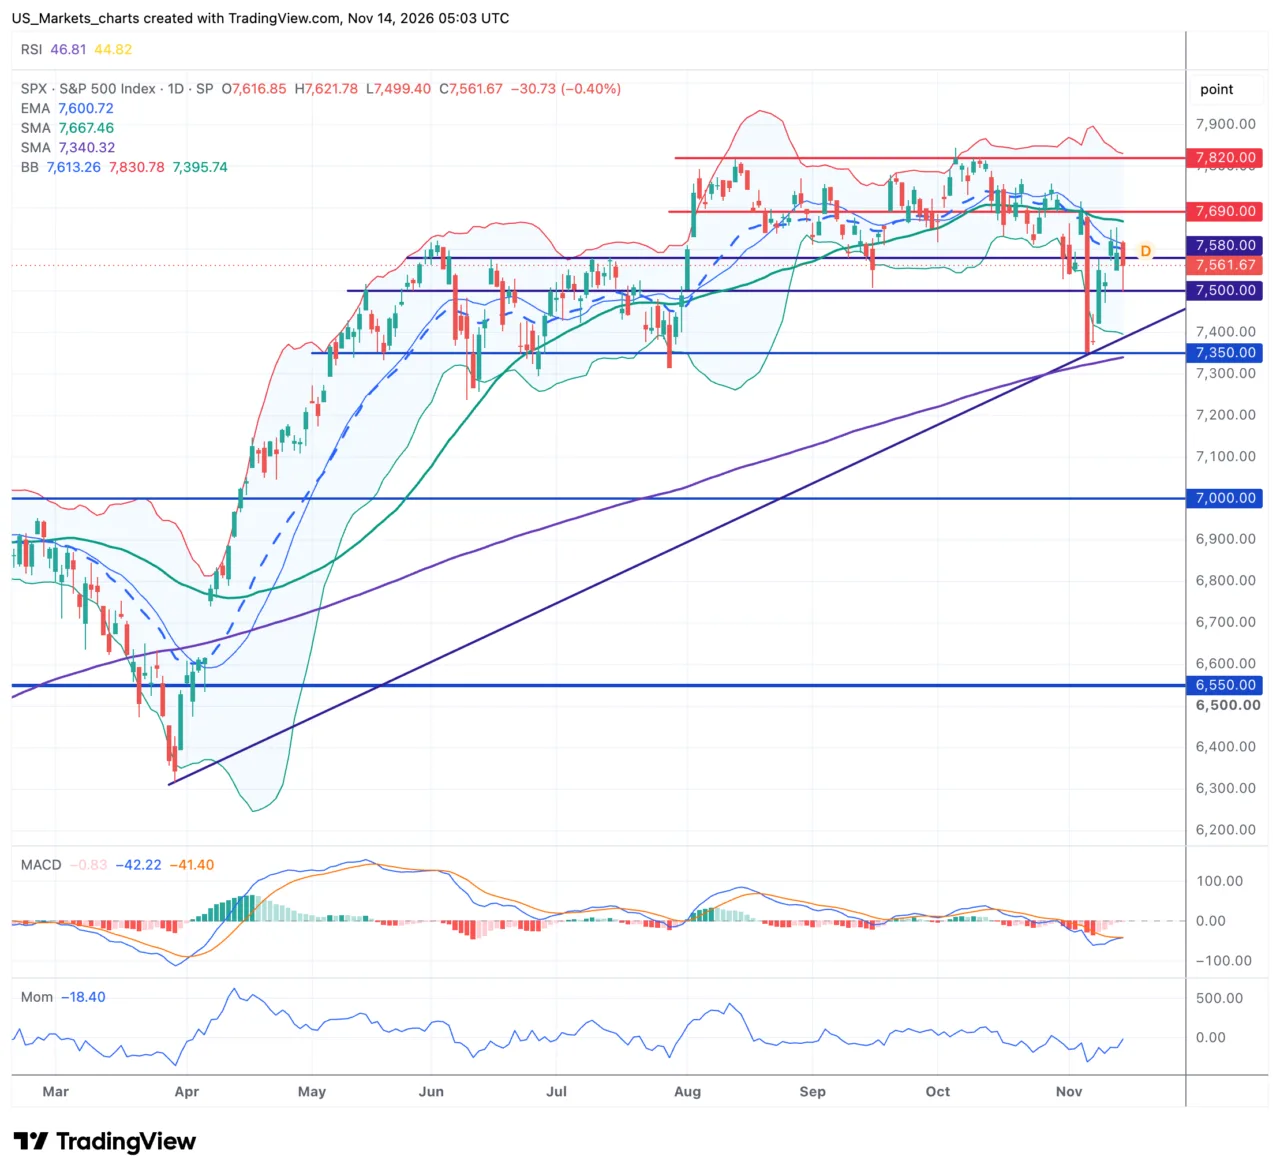 Click the chart to view it in full size. The S&P 500 lost 0.40% on Friday and closed at 7,562, but on a weekly basis a gain of 2.51% remains. The price is below the EMA-20, which comes in at 7,601, and the SMA-50, which comes in at 7,668, but still well above the SMA-200, which comes in at 7,341, so the long term trend remains upward. At the start of November the index tested the rising trend line since March, close to the SMA-200, which comes in at 7,341, after which a strong recovery followed. Since August the price has been moving in a sideways range between 7,500 and 7,820, with resistance at 7,580 and 7,690 and support at 7,500 and 7,350.
In short
Price below the EMA-20 and SMA-50, the short term picture has not recovered yet.
Above the SMA-200, which comes in at 7,341, the long term trend stays intact.
We see a rebound from the support at the rising trend line since March.
The price does not yet break above the resistance at 7,690. The RSI is just below the middle, the MACD is slightly below zero and below the signal line, but momentum is already tentatively turning up. The Bollinger Bands show how far the price is from its 20 day average and how restless the market is. The price trades just below the middle line, in the lower half of the band, a calm picture without an extreme signal.
For the coming sessions we expect a sideways move within the range, as long as the support at 7,500 holds. The price does not yet break above the resistance at 7,690 as long as the EMA-20, which comes in at 7,601, is not recaptured. A close below 7,500 invalidates that scenario.
| Nasdaq 100 Index NDX | FRIDAY -1.22%
WEEK +3.53% |
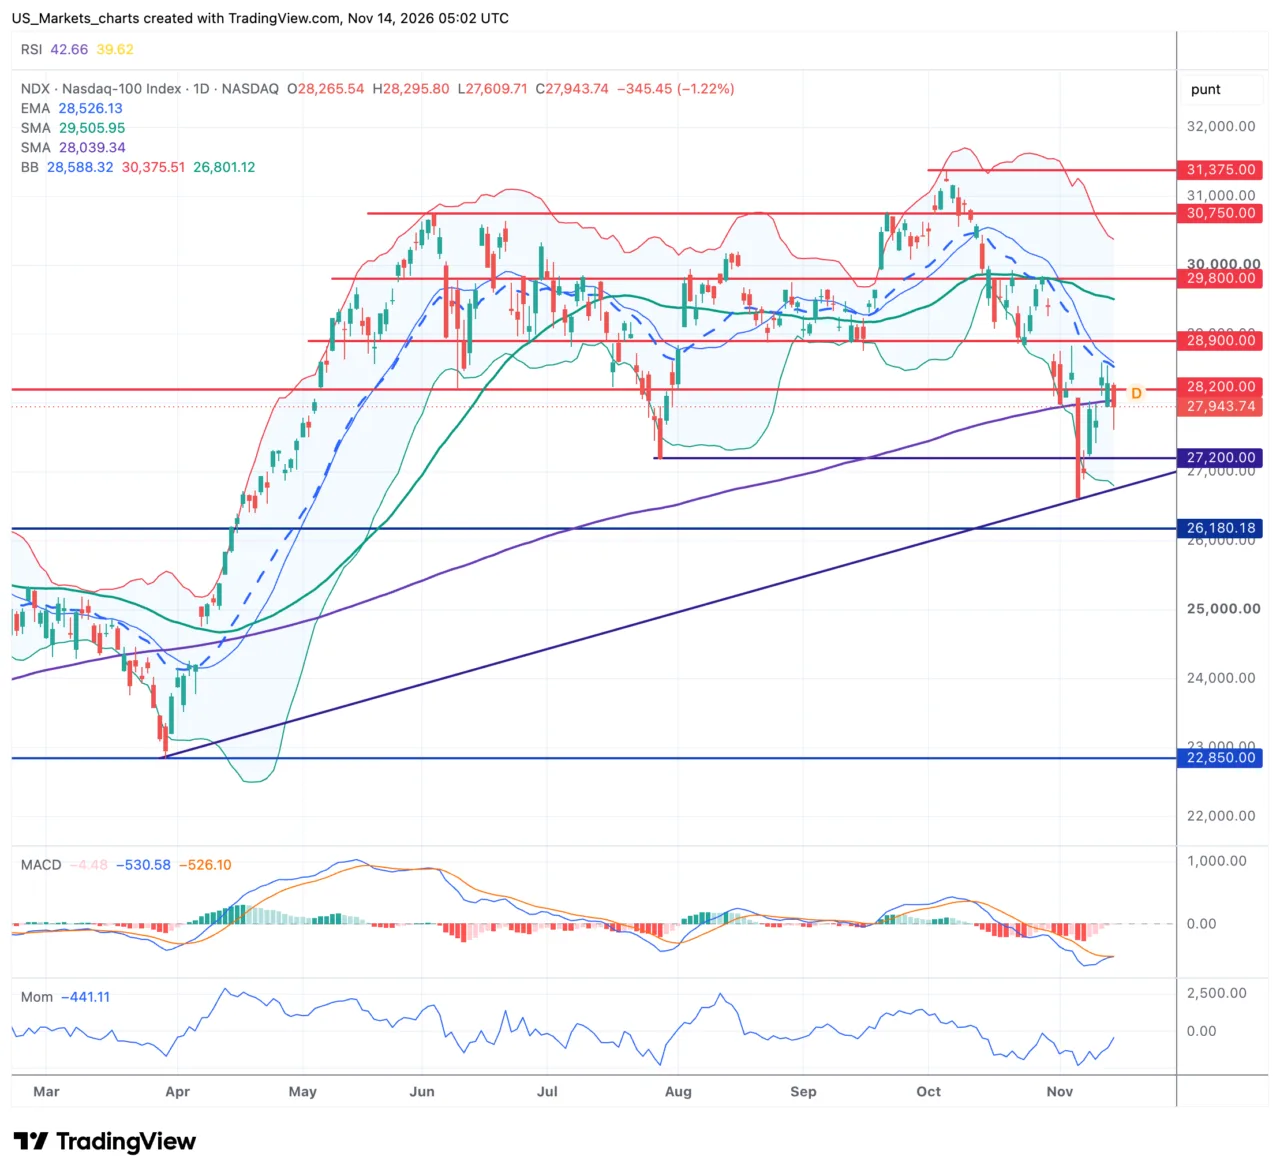 Click the chart to view it in full size. The Nasdaq 100 fell 1.22% on Friday to 27,944, although a weekly gain of 3.53% remains. The price trades below the EMA-20, which comes in at 28,527, and the SMA-50, which comes in at 29,506, and just below the SMA-200, which comes in at 28,040, so the index sits right on the border of the long term trend. At the start of November the price touched the rising trend line around 26,500, after which a recovery followed. After the double top around 30,750 the pattern of lower highs remains intact, with resistance at 28,200 and 28,900 and support at 27,200 and 26,180.
In short
The price dropped just below the SMA-200 again, so the long term trend is under pressure.
The EMA-20 is below the SMA-50, so the medium term remains weak.
We see a rebound from the support at the rising trend line around 26,500.
Momentum is still negative but turning up, selling pressure is easing. The RSI is below the middle and the MACD moves below zero around the signal line, selling pressure is now lower than a week ago. The Bollinger Bands show how far the price is from its 20 day average and how restless the market is. The price trades below the middle line, in the lower half of the band, without touching the lower band.
For the coming sessions we expect a new test of the SMA-200, which comes in at 28,040, and the resistance at 28,200, as long as the support at 27,200 holds. The price does not yet break above the resistance as long as Nvidia causes unrest. A close below 27,200 invalidates that scenario.
| AEX Index AEX | FRIDAY +0.07%
WEEK +1.82% |
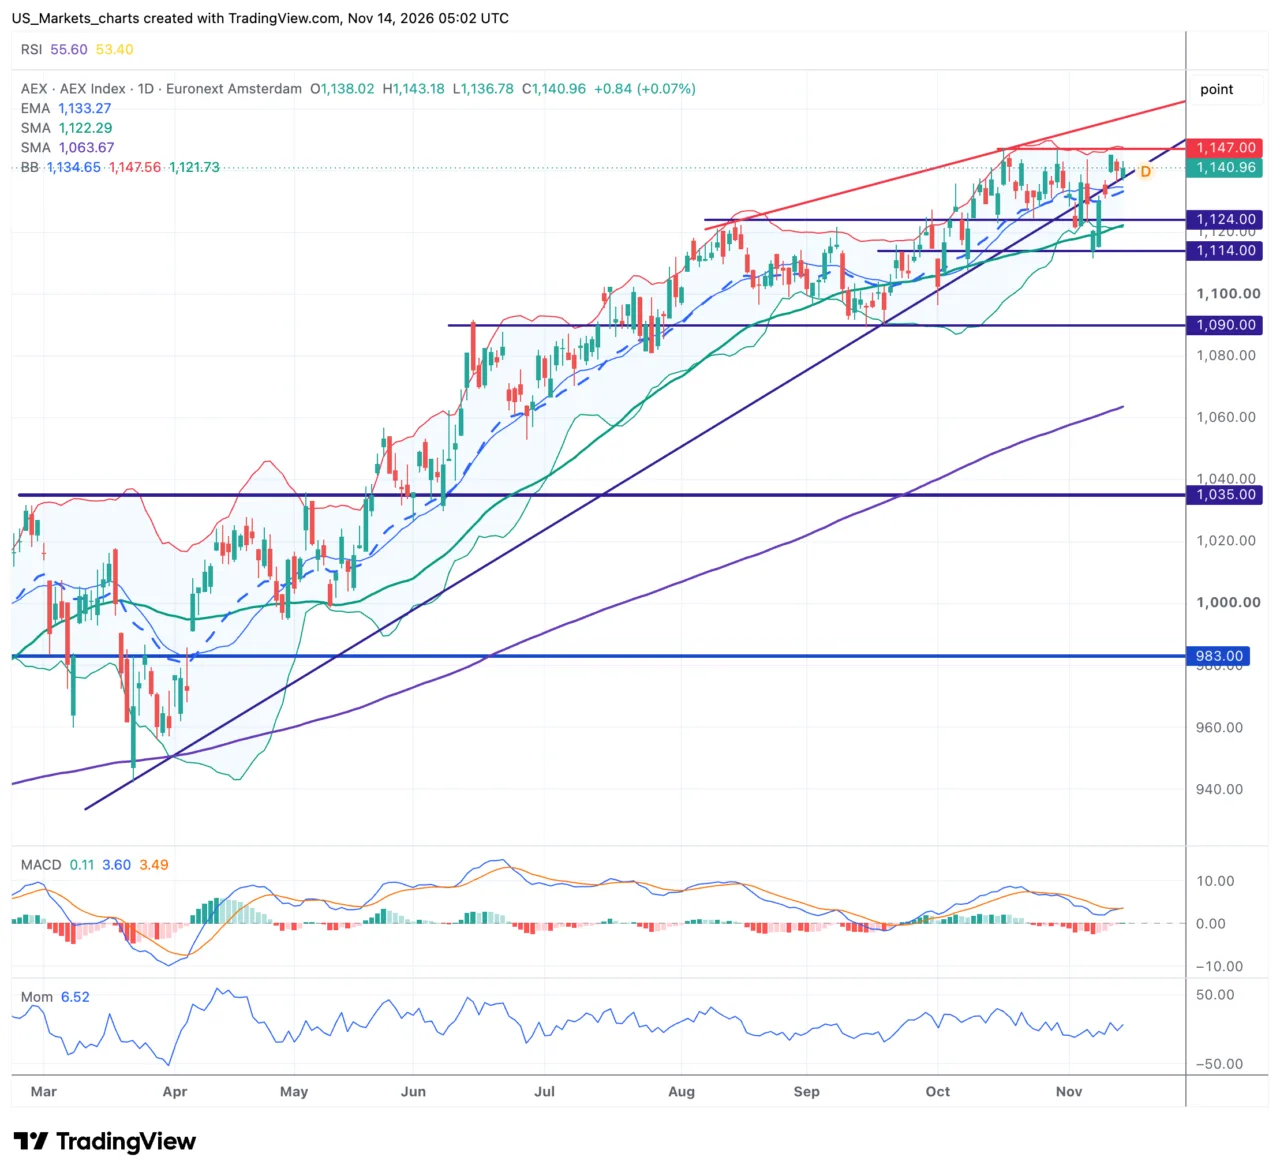 Click the chart to view it in full size. The AEX gained 0.07% on Friday and closed at 1,141, good for a weekly gain of 1.82%. The price trades above the EMA-20, which comes in at 1,134, and the SMA-50, which comes in at 1,123, and also above the SMA-200, which comes in at 1,064, so the trend is upward on all time frames. The resistance at 1,147 has been tested several times, the support lies at 1,124 and 1,114. With higher lows under a flat resistance, an ascending triangle is forming.
In short
The price trades above the EMA-20, the SMA-50 and the SMA-200.
The support at 1,124 holds, with ever higher lows.
The price does not yet break above the resistance at 1,147.
Momentum is slightly positive and the MACD is just above the signal line. The RSI is above the middle, the MACD is just above the signal line and momentum is positive. The Bollinger Bands show that the price sits in the upper half of the band, which is getting narrower, a sign of calm that often precedes a bigger move.
For the coming sessions we expect a new test of the resistance at 1,147, as long as the support at 1,124 holds. Only when the price breaks out above that resistance is the ascending triangle confirmed. A close below 1,124 invalidates that scenario.
| DAX Index DAX | FRIDAY -0.08%
WEEK +3.60% |
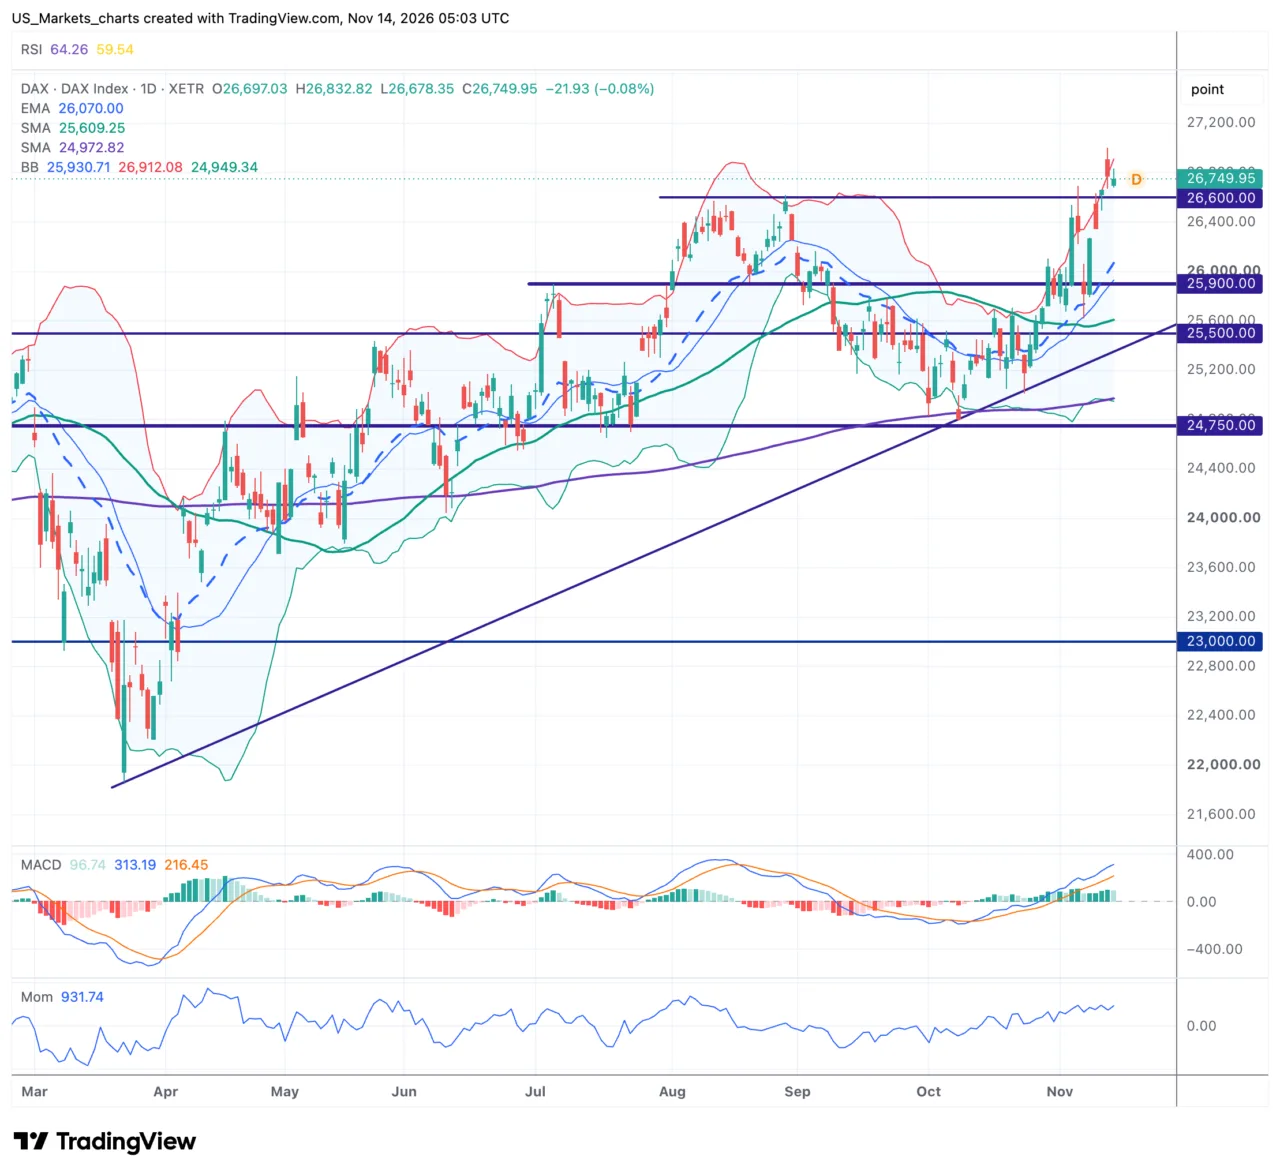 Click the chart to view it in full size. The DAX gave up 0.08% on Friday and closed at 26,750, after a strong week with a gain of 3.60%. The price trades well above the EMA-20, which comes in at 26,070, the SMA-50, which comes in at 25,610, and the SMA-200, which comes in at 24,973, so the upward trend remains solid. This week the index moved above the old August high at 26,600, a real breakout still has to be confirmed. That old high now becomes the 1st support, with further support at 25,900 and 25,500.
In short
The price trades above the EMA-20, the SMA-50 and the SMA-200.
The old high at 26,600 now becomes the support that has to hold.
The MACD is above the signal line and momentum is clearly positive.
The RSI is heading towards overbought, the room to the upside is getting smaller. The RSI is high but still below the overbought level, the MACD is above the signal line and momentum remains strong. The Bollinger Bands show how far the price is from its 20 day average and how strong this index remains. The price trades in the upper half of the band, which is widening, immediately a sign that the move is gaining strength.
For the coming sessions we expect the breakout above 26,600 to hold and the upward trend to continue. A pullback to the old high as a test of the new support remains possible though. A close below 26,600 invalidates that scenario.
05 • Market psychology
Cash is a position too
After a month that started badly, the temptation is big to step straight back into the market in full. Trader Guy did exactly the opposite this week, he took profit on the small positions on the S&P 500 and the Nasdaq 100 and now has just 1 small position open on a European index. That is not a lack of courage, it is a conscious choice. For the month of November we are back at break even in a careful way. Do not forget that November has been very volatile and difficult so far.
I keep hammering on the point that cash is a position too. Anyone without positions looks at the market with a calm head and does not have to hope that a price moves the right way. In a week with the Nvidia results and the Anthropic IPO that is worth gold, because that is exactly when emotions go in all directions.
We know from experience that the best opportunities often present themselves when the rest of the market is in panic or in euphoria. Whoever then has money and patience left can strike on their own terms.
Become a member and follow us for €15 until 1 January
06 • Week in numbers
Yields up, fear down
| Week in numbers |
| Item | Level | Week |
| 10 year yield | 5.15% | higher |
| 30 year yield | 5.48% | higher |
| Brent oil | $96.13 | -2.5% |
| Gold | $3,887 | -4.6% |
| Silver | $48.65 | -5.43% |
| VIX | 19.30 | -24.7% |
The inflation figures that came in higher than expected pushed the 10 and 30 year yields further up, and a stronger yield pushed gold and silver sharply lower. The VIX fell almost a quarter and is back below 20, a sign that the panic of early November has largely faded for now.
07 • Outlook Week 47
Nvidia and Anthropic decide the week
Next week revolves around 2 names. On Tuesday 17 November after the close Nvidia reports quarterly results, the market expects revenue of around $108.9 billion and the options market is pricing in a price move of more than 10% in either direction. On Wednesday evening the price of the Anthropic shares is set and the 1st trading day follows on Thursday 19 November.
In addition, results from retailers such as Home Depot, Lowe's, Target and TJX are on the calendar. Intuit follows on Thursday after the close. On the macro side, US retail sales on Tuesday are the most important figure.
Macro calendar next week
Monday 16 November: Empire State index, Eurozone industrial production.
Tuesday 17 November: German ZEW index, US retail sales for October, industrial production and import prices, Nvidia results after the close.
Wednesday 18 November: US housing starts and building permits, eurozone inflation, pricing of Anthropic.
Thursday 19 November: Philly Fed index, weekly jobless claims, 1st trading day of Anthropic.
Friday 20 November: Michigan consumer confidence, eurozone consumer confidence.
Risk warning:
Investing involves risks, you may lose your investment in whole or in part. This newsletter is for information purposes only and does not constitute individual investment advice.
All information in this newsletter has been checked as well as possible, but a lot is now generated with AI, so some mistakes may still slip in.
Sources:
TradingView, Yahoo Finance, MarketWatch, TheStreet.com, CNBC, AP, Renaissance Capital and own price data from USMarkets.nl.
US Markets • USMarkets.nl
© 2026 USMarkets.nl • Trader Guy • For information only • No investment advice
USMarkets.nl • TraderShop • Unsubscribe
|
|