Saturday 21 November 2026 • Week 47 • Weekly overview
A 'Black Friday' on Wall Streetby Trader Guy
Black Friday apparently came a week early this year, but with a different meaning. On Friday 20 November Wall Street went through its darkest session in months, with the Dow Jones and the S&P 500 in correction territory and the Nasdaq losing its entire gain for 2026. The chip sector took the hardest hits, the SOX lost almost 19% on a weekly basis.
Nvidia was at the centre of it all. Reuters reported an SEC investigation into the company's accounting, less than 2 weeks after the departure of chief executive Jensen Huang, and the stock has now fallen some 46% below its record close of 6 October, a loss of roughly $2.7 trillion in market value. The long awaited IPO of Anthropic also had to weather the storm, while investors brace for a week with fewer trading days because of Thanksgiving.
01 • Closing session Week 47
10 out of 10 indices in the red
On Friday 20 November things went wrong on every front. The S&P 500 lost 3.70% and closed at 6,910 points, the Nasdaq Composite fell 5.28% to 22,618 points and the Nasdaq 100 gave up 5.61% to 25,029 points. The chip index SOX took the heaviest blow with a loss of 10.73% to 8,409 points. The Dow Jones kept the damage relatively limited with a decline of 1.93% to 48,147 points, but it did not escape correction territory either, which means an index stands more than 10% below its peak.
On a weekly basis all 10 indices in the table closed in the red. The CAC 40 is still the strongest of the 10 with a loss of 5%, the SOX is by far the weakest at -19.24%. In Europe the AEX lost 6.32% and the DAX 7.1% on a weekly basis, there was no escaping the sell off there either.
Closing levels week 47
Index
Close
Friday
Week
S&P 500
6,910
-3.70%
-9.27%
Dow Jones
48,147
-1.93%
-8.27%
Nasdaq Composite
22,618
-5.28%
-10.98%
Nasdaq 100
25,029
-5.61%
-11.45%
SOX WEAKEST
8,409
-10.73%
-19.24%
Russell 2000
2,582
-2.76%
-7.99%
AEX
1,066.2
-2.36%
-6.32%
BEL 20
5,798
-1.49%
-5.11%
CAC 40 STRONGEST
7,928
-1.89%
-4.98%
DAX
24,803
-2.60%
-7.10%
The view of Trader Guy
It looks as if Black Friday came a week early this year. As if the previous weeks had not been tough enough, we took another hefty extra blow on Friday. All indices and all regions had to give up a lot of ground. Nvidia, once the star stock of the AI rally, has now almost halved from its peak and lost roughly $2.7 trillion in market value since its record in early October. The Dow Jones and the S&P 500 have entered correction territory, so they are now more than 10% below their highest point. The Nasdaq fell 5.28% and wiped out its entire gain for 2026, while the AI trade keeps collapsing.
On Friday investors clearly chose the flight to safety, with semiconductors leading the sell off on doubts about the AI trade. Nvidia fell another 14%, but AMD, Broadcom and Micron also suffered double digit losses. It immediately became the worst week of the year, the SOX index lost almost 19%.
These are unprecedented markets right now, the volatility is like nothing we have seen. There has not been a single calm session in recent weeks. The market is longing for calm more than ever. The problem is that the entire AI trade is clearly being skimmed off. The speculators are being pushed out and investors are becoming fearful again, with flashbacks to the start of this century and the dotcom bubble, and above all to the financial crisis of 2008. Nvidia, which looks bad at the moment, was already called the bank of AI during the AI rally, even though it is of course not a bank at all. Then you quickly start thinking of a mega company that has bitten off more than it can chew, and of course you can never say with certainty that such a company cannot fall over. If Nvidia loses even more of the confidence of investors, things can move further quickly. As I often say, never say never on the stock market, because the unexpected can always happen.
There is still far too much easily borrowed money in the market, and that is causing margin calls to rear their heads. Too much was borrowed against the portfolios of speculators, and as soon as the collateral falls away, forced sales follow, which naturally makes the decline accelerate.
Is it already over? I do not think so. After such a bad week a solid move up may well come, a decline never goes in 1 straight line after all. There are also plenty of investors who have missed out on something lately and now want to get in at much more attractive prices. The shares of Anthropic could also be picked up around their own IPO price again, after that price was defended tooth and nail, because of course nobody wants to stumble right away with such a large IPO.
Reuters reported on Friday that SEC staff are investigating possible accounting issues at Nvidia, less than 2 weeks after the departure of Jensen Huang as chief executive. Interim CEO Colette Kress, previously chief financial officer, now leads the company. An SEC investigation is not a finding of wrongdoing and regularly ends without any follow up, but it did fuel the uncertainty on Friday.
Next week is a shortened trading week because of Thanksgiving. The exchanges are closed on Thursday 26 November and Friday 27 November is a shortened session. On Wednesday 25 November the PCE inflation figure is on the agenda, the preferred measure of the Fed.
02 • Market themes Week 47
4 themes of the week
Nvidia under pressure from SEC investigation
Reuters reported on Friday that the SEC is investigating possible accounting issues at Nvidia, less than 2 weeks after the abrupt departure of Jensen Huang as CEO. The stock plunged 14% on Friday to $125.53, its worst day since the DeepSeek moment in early 2026.
Nvidia now trades some 46% below its record close of $239.24 on 6 October, a loss of roughly $2.7 trillion in market value. The company is now worth only about $3.1 trillion. An SEC investigation is not proof of wrongdoing and often ends without further steps.
Chip sector in free fall
It was not only Nvidia that took a beating. AMD fell 13.25% on Friday to $424.39, Broadcom lost 12.19% to $304.41 and Micron gave up 13.89% to $594.51. Broadcom was hit extra hard by reports that Alphabet would scale back its orders for AI chips from the company.
The SOX index lost almost 19% on a weekly basis, the worst week of the year for the chip sector and by far the weakest of all 10 indices in our table.
Dow and S&P 500 in correction territory
The Dow Jones and the S&P 500 fell more than 10% below their highest point this week and are therefore officially in correction territory. The Nasdaq Composite lost its entire gain for 2026.
Now that the prices of many speculative positions are sliding, margin calls are also starting to play a role for some parties. When the collateral on borrowed positions falls away, forced sales follow, which can accelerate the decline further.
Anthropic passes its 1st test
Anthropic went public this week at $83 per share, above the previously announced price range of $70 to $78, raising more than $81 billion in capital and making it the largest IPO ever.
Despite the broader sell off, the IPO price was firmly defended in recent days, investors do not seem to want the largest IPO of the year to go under water right away.
03 • Company news
What else stood out
Things went hard outside the chip sector too. Tesla fell 7.64% on Friday to $345.82 and Apple gave up 1.90% to $342.56, in a session in which virtually no big name escaped the wave of selling.
Remarkably, gold, silver and bitcoin offered no safe haven this week either and closed sharply lower, while yields on government bonds actually fell as investors fled into US Treasuries.
Black Friday offer • Guy Systeem Trading
Become a member now for €25 until 1 February 2027
Clear trading signals on indices, stocks and ETFs, both LONG and SHORT, with concrete entry zones, price targets and stops per position. This week there was every reason to be cautious and preserve capital, and with the market in correction territory new opportunities are emerging for those who want to get in with a clear plan.
Total up to and including the interim result of November 2026
€15,680
Results are an indication based on closed positions, no guarantee for the future.
04 • Technical Analysis
5 charts deep in the red, the RSI oversold
S&P 500 Index SPX
VRIJDAG -3.70%WEEK -9.27%
Click on the chart to view it at full size.
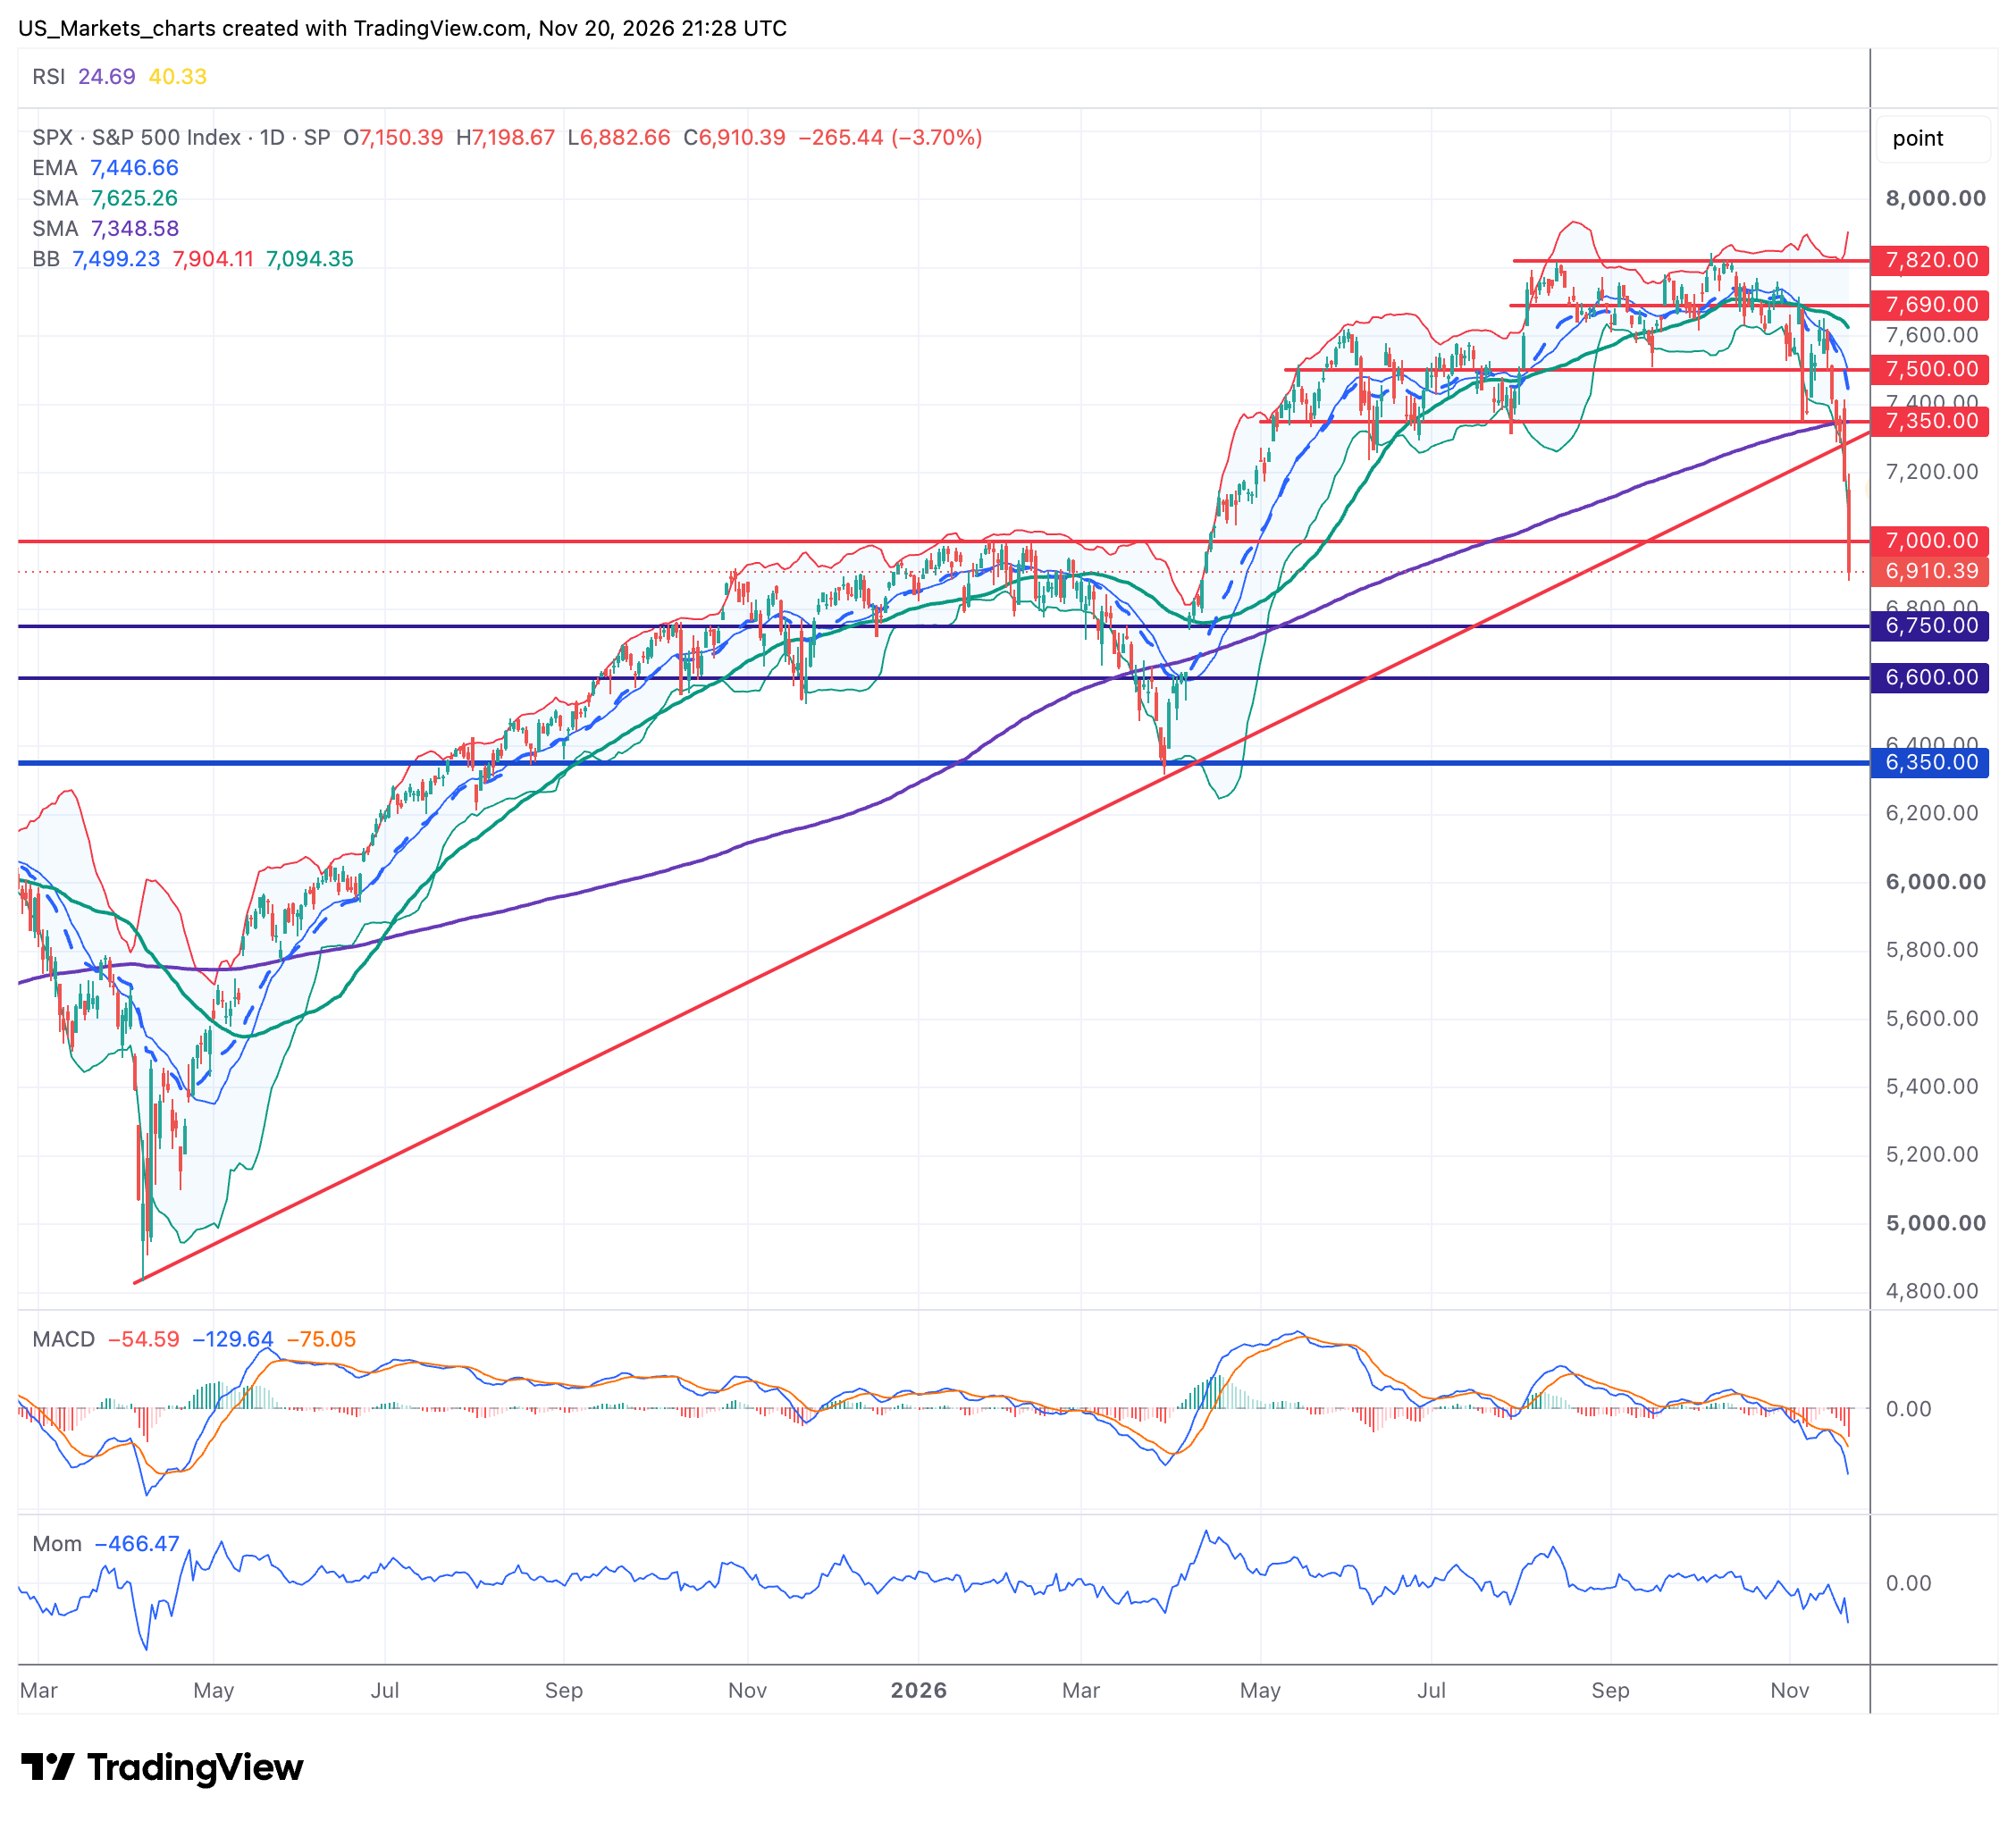
The S&P 500 lost 3.70% on Friday and closed at 6,910, a weekly loss of 9.27%. The price is falling through both the EMA-20, which comes in at 7,447, and the SMA-50, which comes in at 7,626, and for the 1st time since the start of the uptrend also through the SMA-200, which comes in at 7,349. With that the price also broke the long running rising trendline and the support at 7,000. The next supports are at 6,750 and 6,600, the old support at 7,000 now becomes the 1st resistance.
In short
The price is not yet getting above the resistance at 7,000, a level that actually provided support until Friday.
For the first time in the entire rise the price is below the SMA-200, which comes in at 7,349.
The SMA-50 is still above the SMA-200, so there is no death cross yet.
The MACD is deep below zero and below the signal line, momentum is strongly negative.
The RSI is deep in oversold territory, clearly below 30. The MACD and momentum both point firmly down, without signs of positive divergence. The Bollinger Bands show how far the price is from the 20 day average and how restless the market is. The bands are far apart and the price is closing below the lower band, a sign of a very restless market with a strong downward spike.
For the coming sessions we are allowing for a further test of the support at 6,750 and possibly 6,600, although the deeply oversold RSI may first trigger a rebound towards the old support at 7,000. The price will not get above that resistance as long as the SMA-200 has not been reclaimed. A close below 6,600 invalidates the recovery scenario.
Dow Jones Index DJI
VRIJDAG -1.93%WEEK -8.27%
Click on the chart to view it at full size.
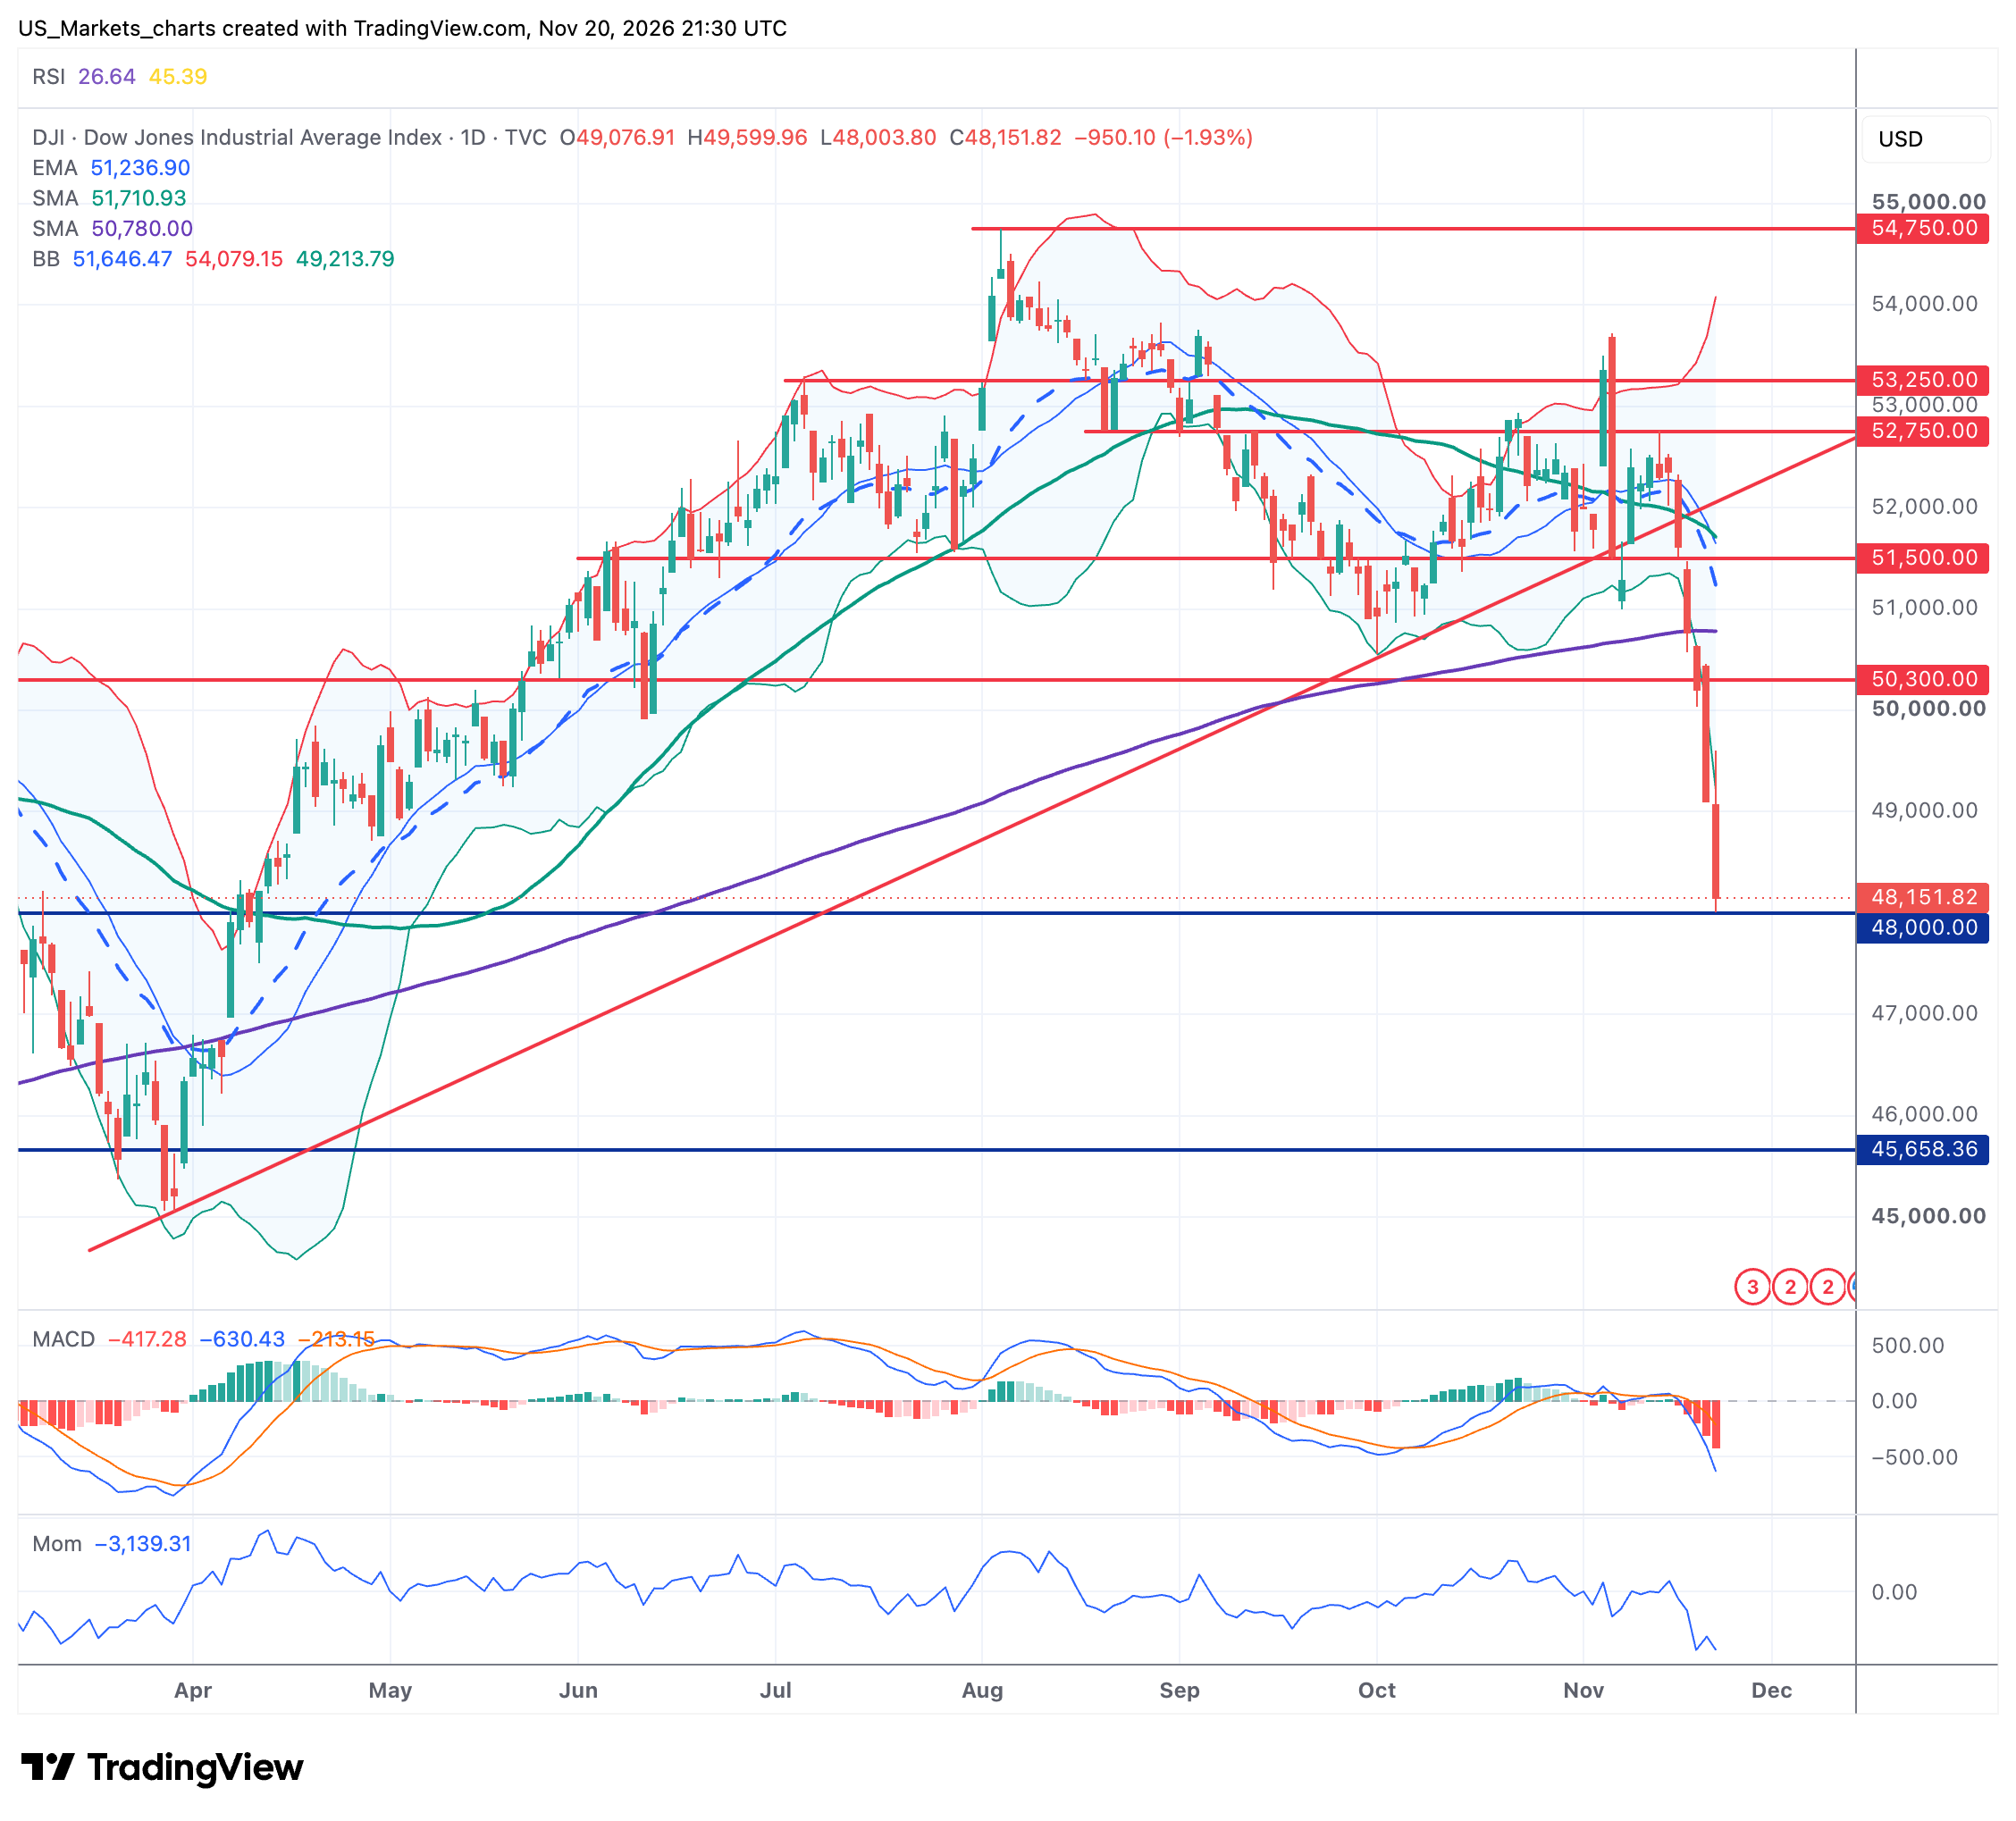
The Dow Jones lost 1.93% on Friday and closed at 48,147, a weekly loss of 8.27%. The price is falling through the EMA-20, which comes in at 51,232, the SMA-50, which comes in at 51,706, and the SMA-200, which comes in at 50,776, and on Friday it tested the round support at 48,000. The next resistance is at 50,300, the old high of this year.
In short
The price slid away again after a test of the support at 48,000, which is just about holding on a closing basis.
The price is not yet getting above the resistance at 50,300.
The SMA-50 is still above the SMA-200, so there is no death cross yet.
The MACD is below zero and below the signal line, momentum is strongly negative.
The RSI is deep in oversold territory, clearly below 30. The MACD and momentum are firmly negative. The Bollinger Bands show how far the price is from the 20 day average and how restless the market is. The bands widened strongly this week and the price is trading just above the lower band, a sign of a very restless market.
For the coming sessions we expect the support at 48,000 to remain crucial, with the deeply oversold indicators as a basis for a possible countermove. The price will not yet get above the resistance at 50,300 as long as the averages keep falling. A close below 48,000 makes a further decline more likely.
Nasdaq 100 Index NDX
VRIJDAG -5.61%WEEK -11.45%
Click on the chart to view it at full size.
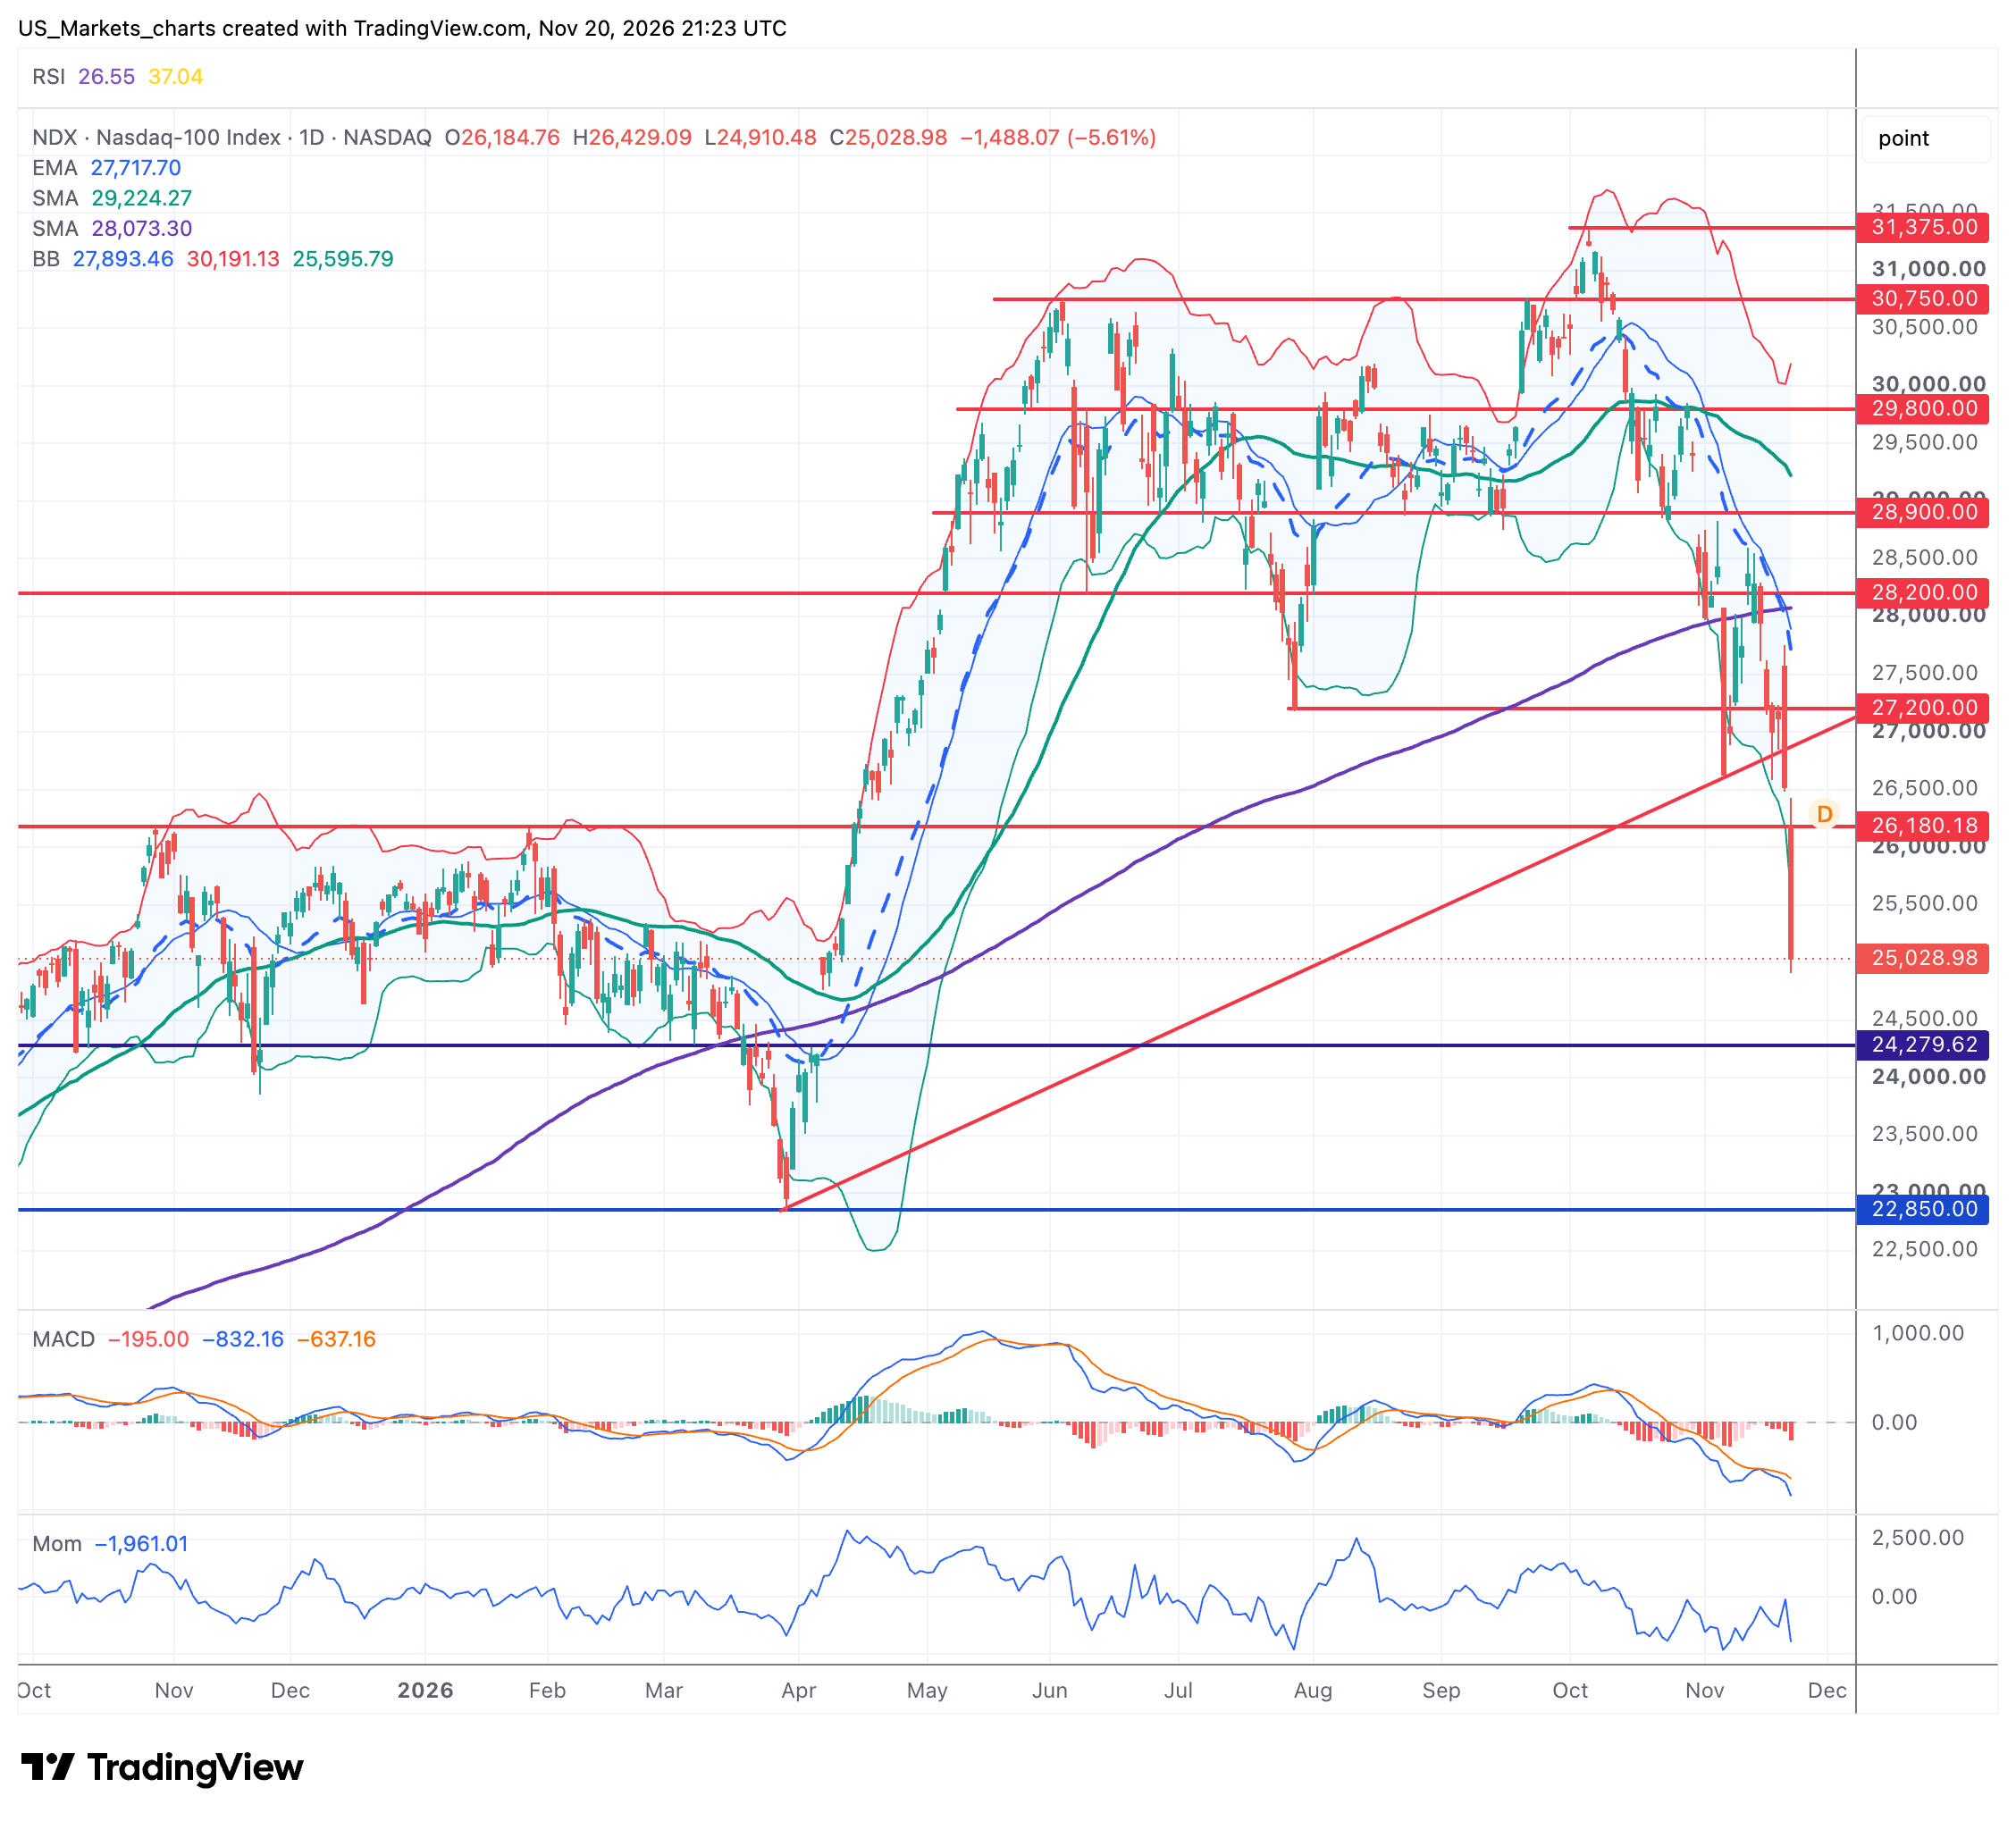
The Nasdaq 100 lost 5.61% on Friday and closed at 25,029, a weekly loss of 11.45%, the heaviest of the 2 Nasdaq benchmarks. The price is now well below the EMA-20, which comes in at 27,718, the SMA-50, which comes in at 29,225, and the SMA-200, which comes in at 28,074. The price fell straight through the support at 27,200 to the next support at 26,180, which did not hold either. We now see a deeper support at 24,280.
In short
The price is sliding away again after a test of the support at 27,200, which did not hold. The 26,180 did not hold either.
The double top around 31,375 from the summer has been confirmed by this move.
The SMA-50 is still above the SMA-200, so for now there is no death cross yet.
The MACD is deep below zero, momentum is strongly negative.
The RSI is deep in oversold territory, clearly below 30. The MACD and momentum point firmly down. The Bollinger Bands show how far the price is from the 20 day average and how restless the market is. The bands are far apart and the price is trading close to the lower band, a sign of a very restless market.
For the coming sessions we are allowing for a further test below the support at 26,180, with 24,280 as the next safety net. The price will certainly not get back above the resistance at 27,200 as long as the AI trade remains under pressure. The close below 26,180 makes further downward pressure towards 24,280 more likely.
Philadelphia Semiconductor Index SOX
VRIJDAG -10.73%WEEK -19.24%
Click on the chart to view it at full size.
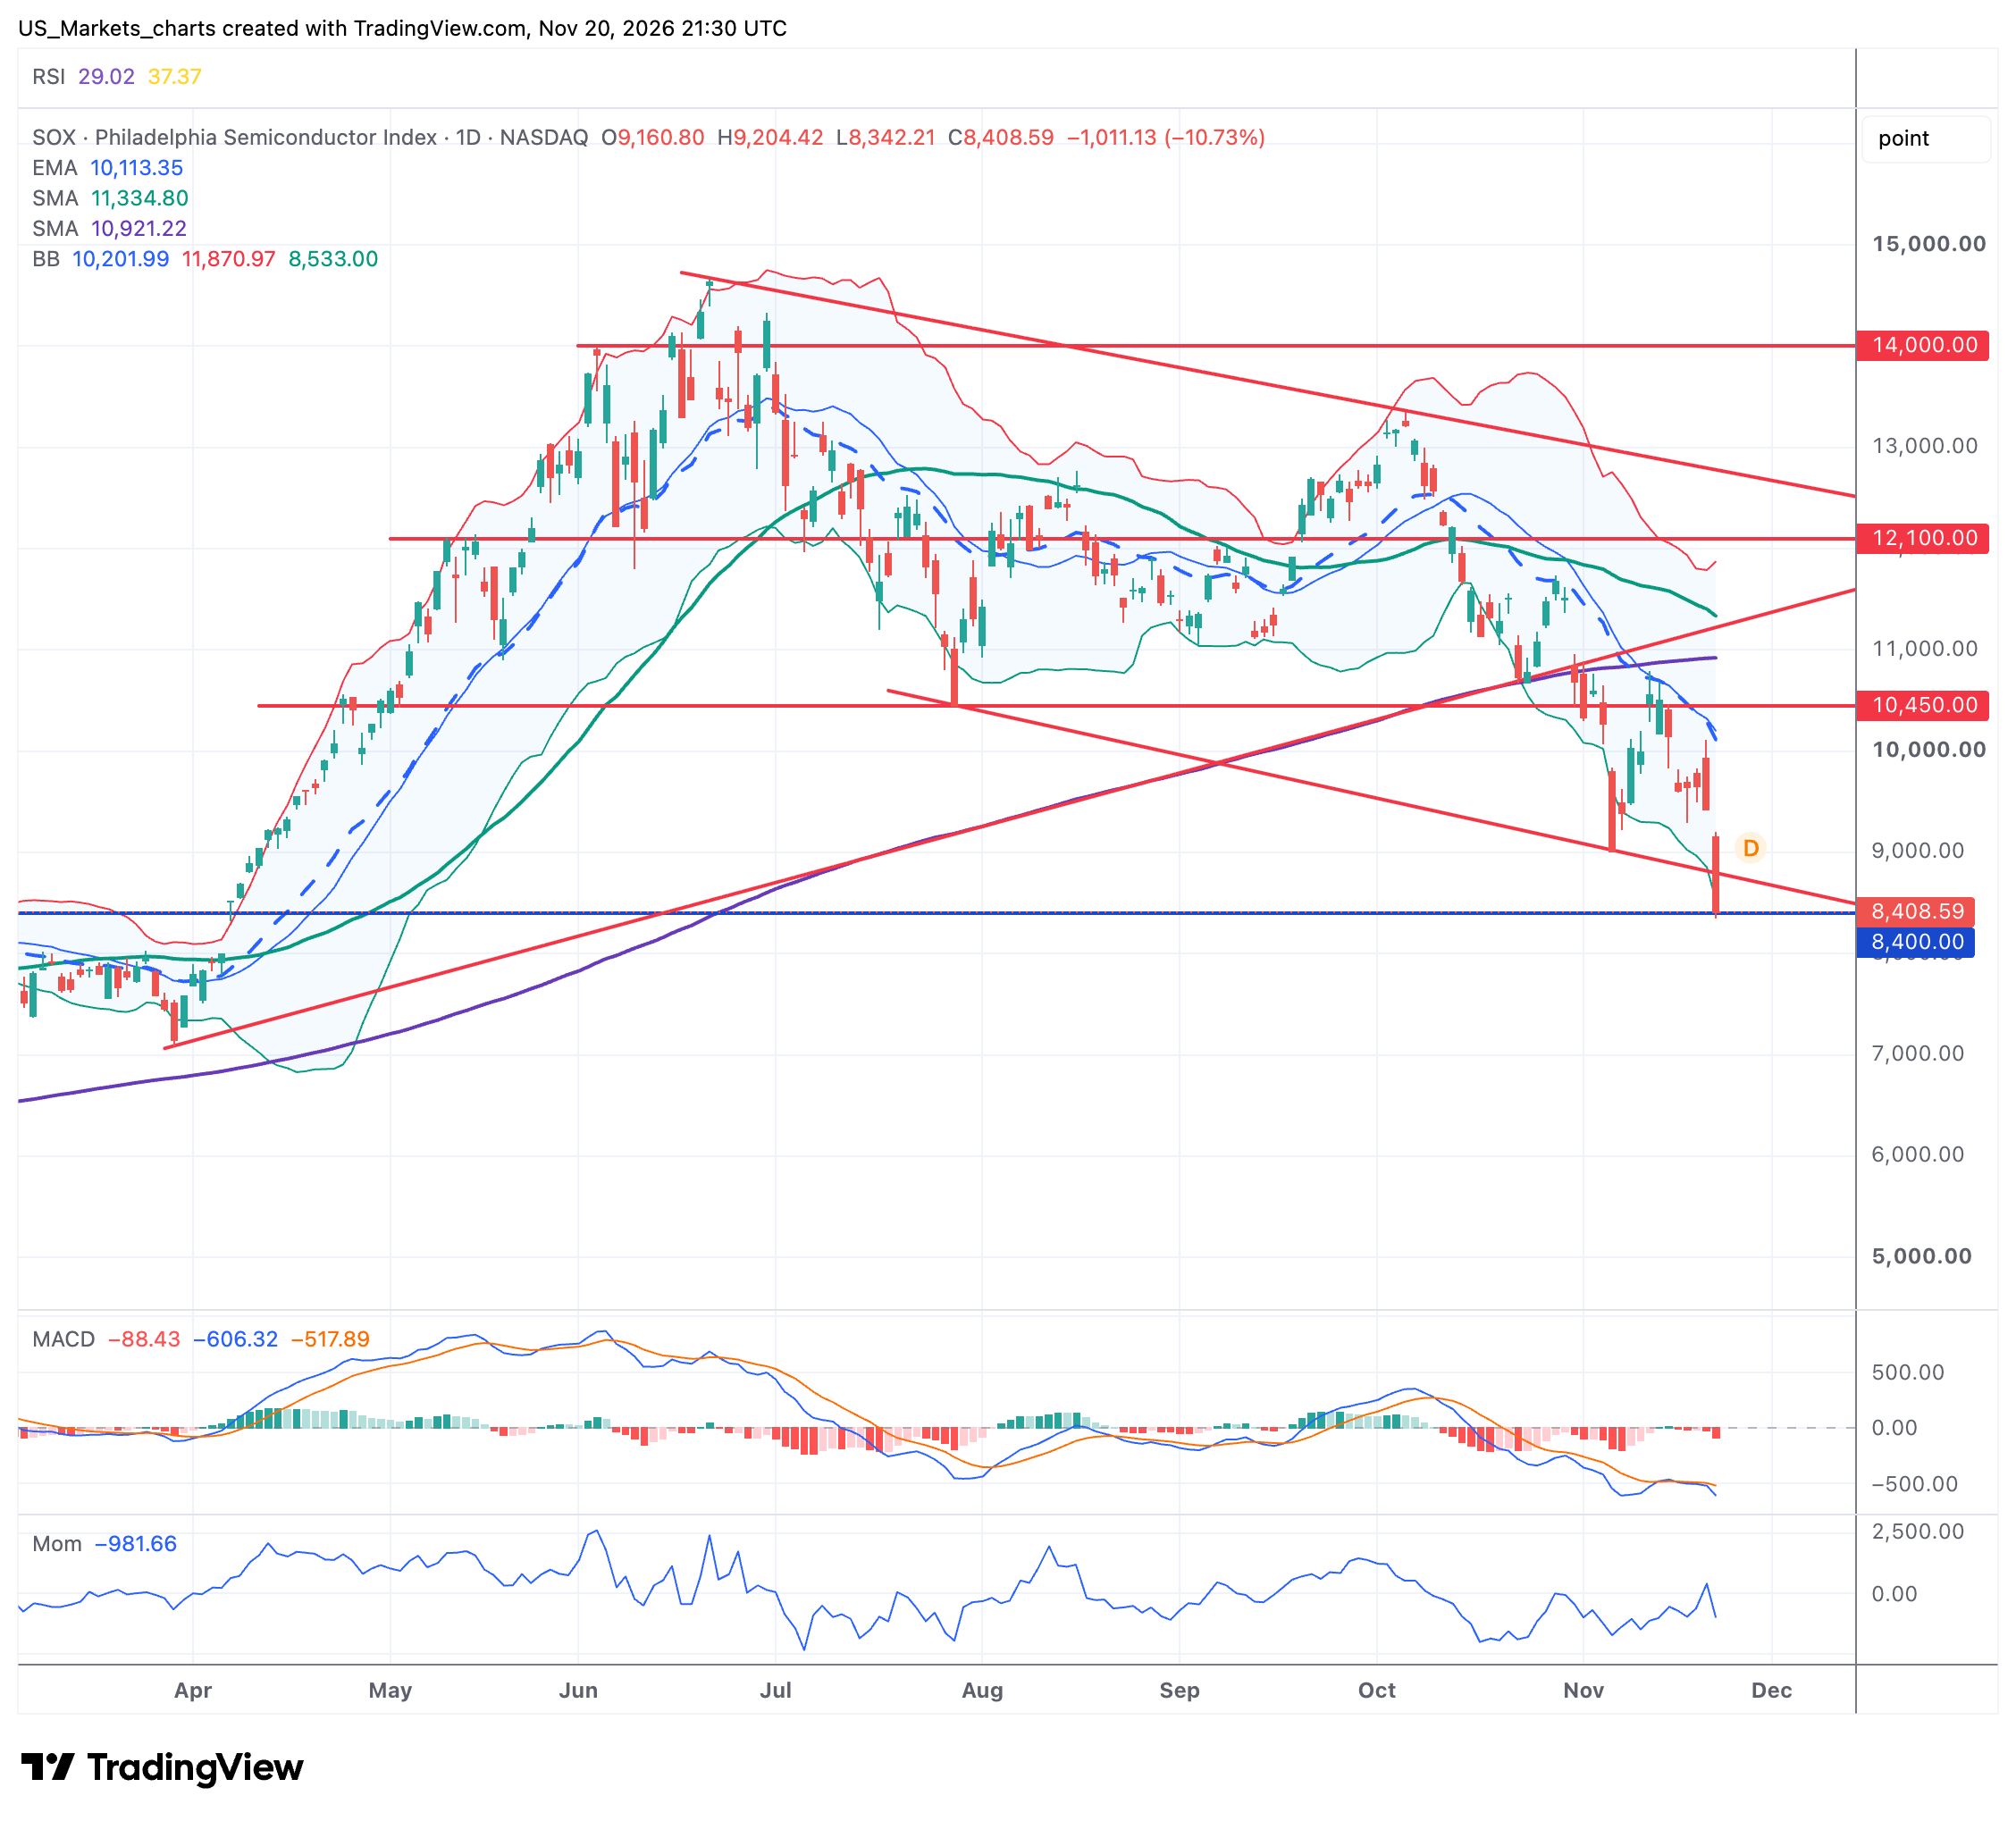
The SOX lost 10.73% on Friday and closed at 8,409, a weekly loss of 19.24%, by far the heaviest move of the 5 charts. The price is now deep below the EMA-20, which comes in at 10,114, the SMA-50, which comes in at 11,335, and the SMA-200, which comes in at 10,922. The index fell all the way back to the support at 8,400, the base from which the entire rise of this year started, and has thereby effectively wiped out the entire gain for 2026.
In short
The price is testing the support at 8,400, the last foothold for the index this year.
The broader top that has been forming since the summer around 14,000 has been fully confirmed by this decline.
The SMA-50 is still above the SMA-200, so there is no death cross yet, but the lines are now converging fast.
The MACD is deep below zero, momentum is extremely negative.
The RSI is in oversold territory, just below 30. The MACD and momentum are extremely negative, without any sign of positive divergence. The Bollinger Bands show how far the price is from the 20 day average and how restless the market is. The bands widened enormously this week, the price is trading just above the lower band, a sign of a very restless market with a sharp downward spike.
For the coming sessions the support at 8,400 is the tipping point, with the deeply oversold indicators as a basis for a possible relief rally. The price will no longer get above the earlier support zone at 10,450 as long as the chip sector remains under pressure. A close below the important 8,400 makes a further acceleration of the decline more likely.
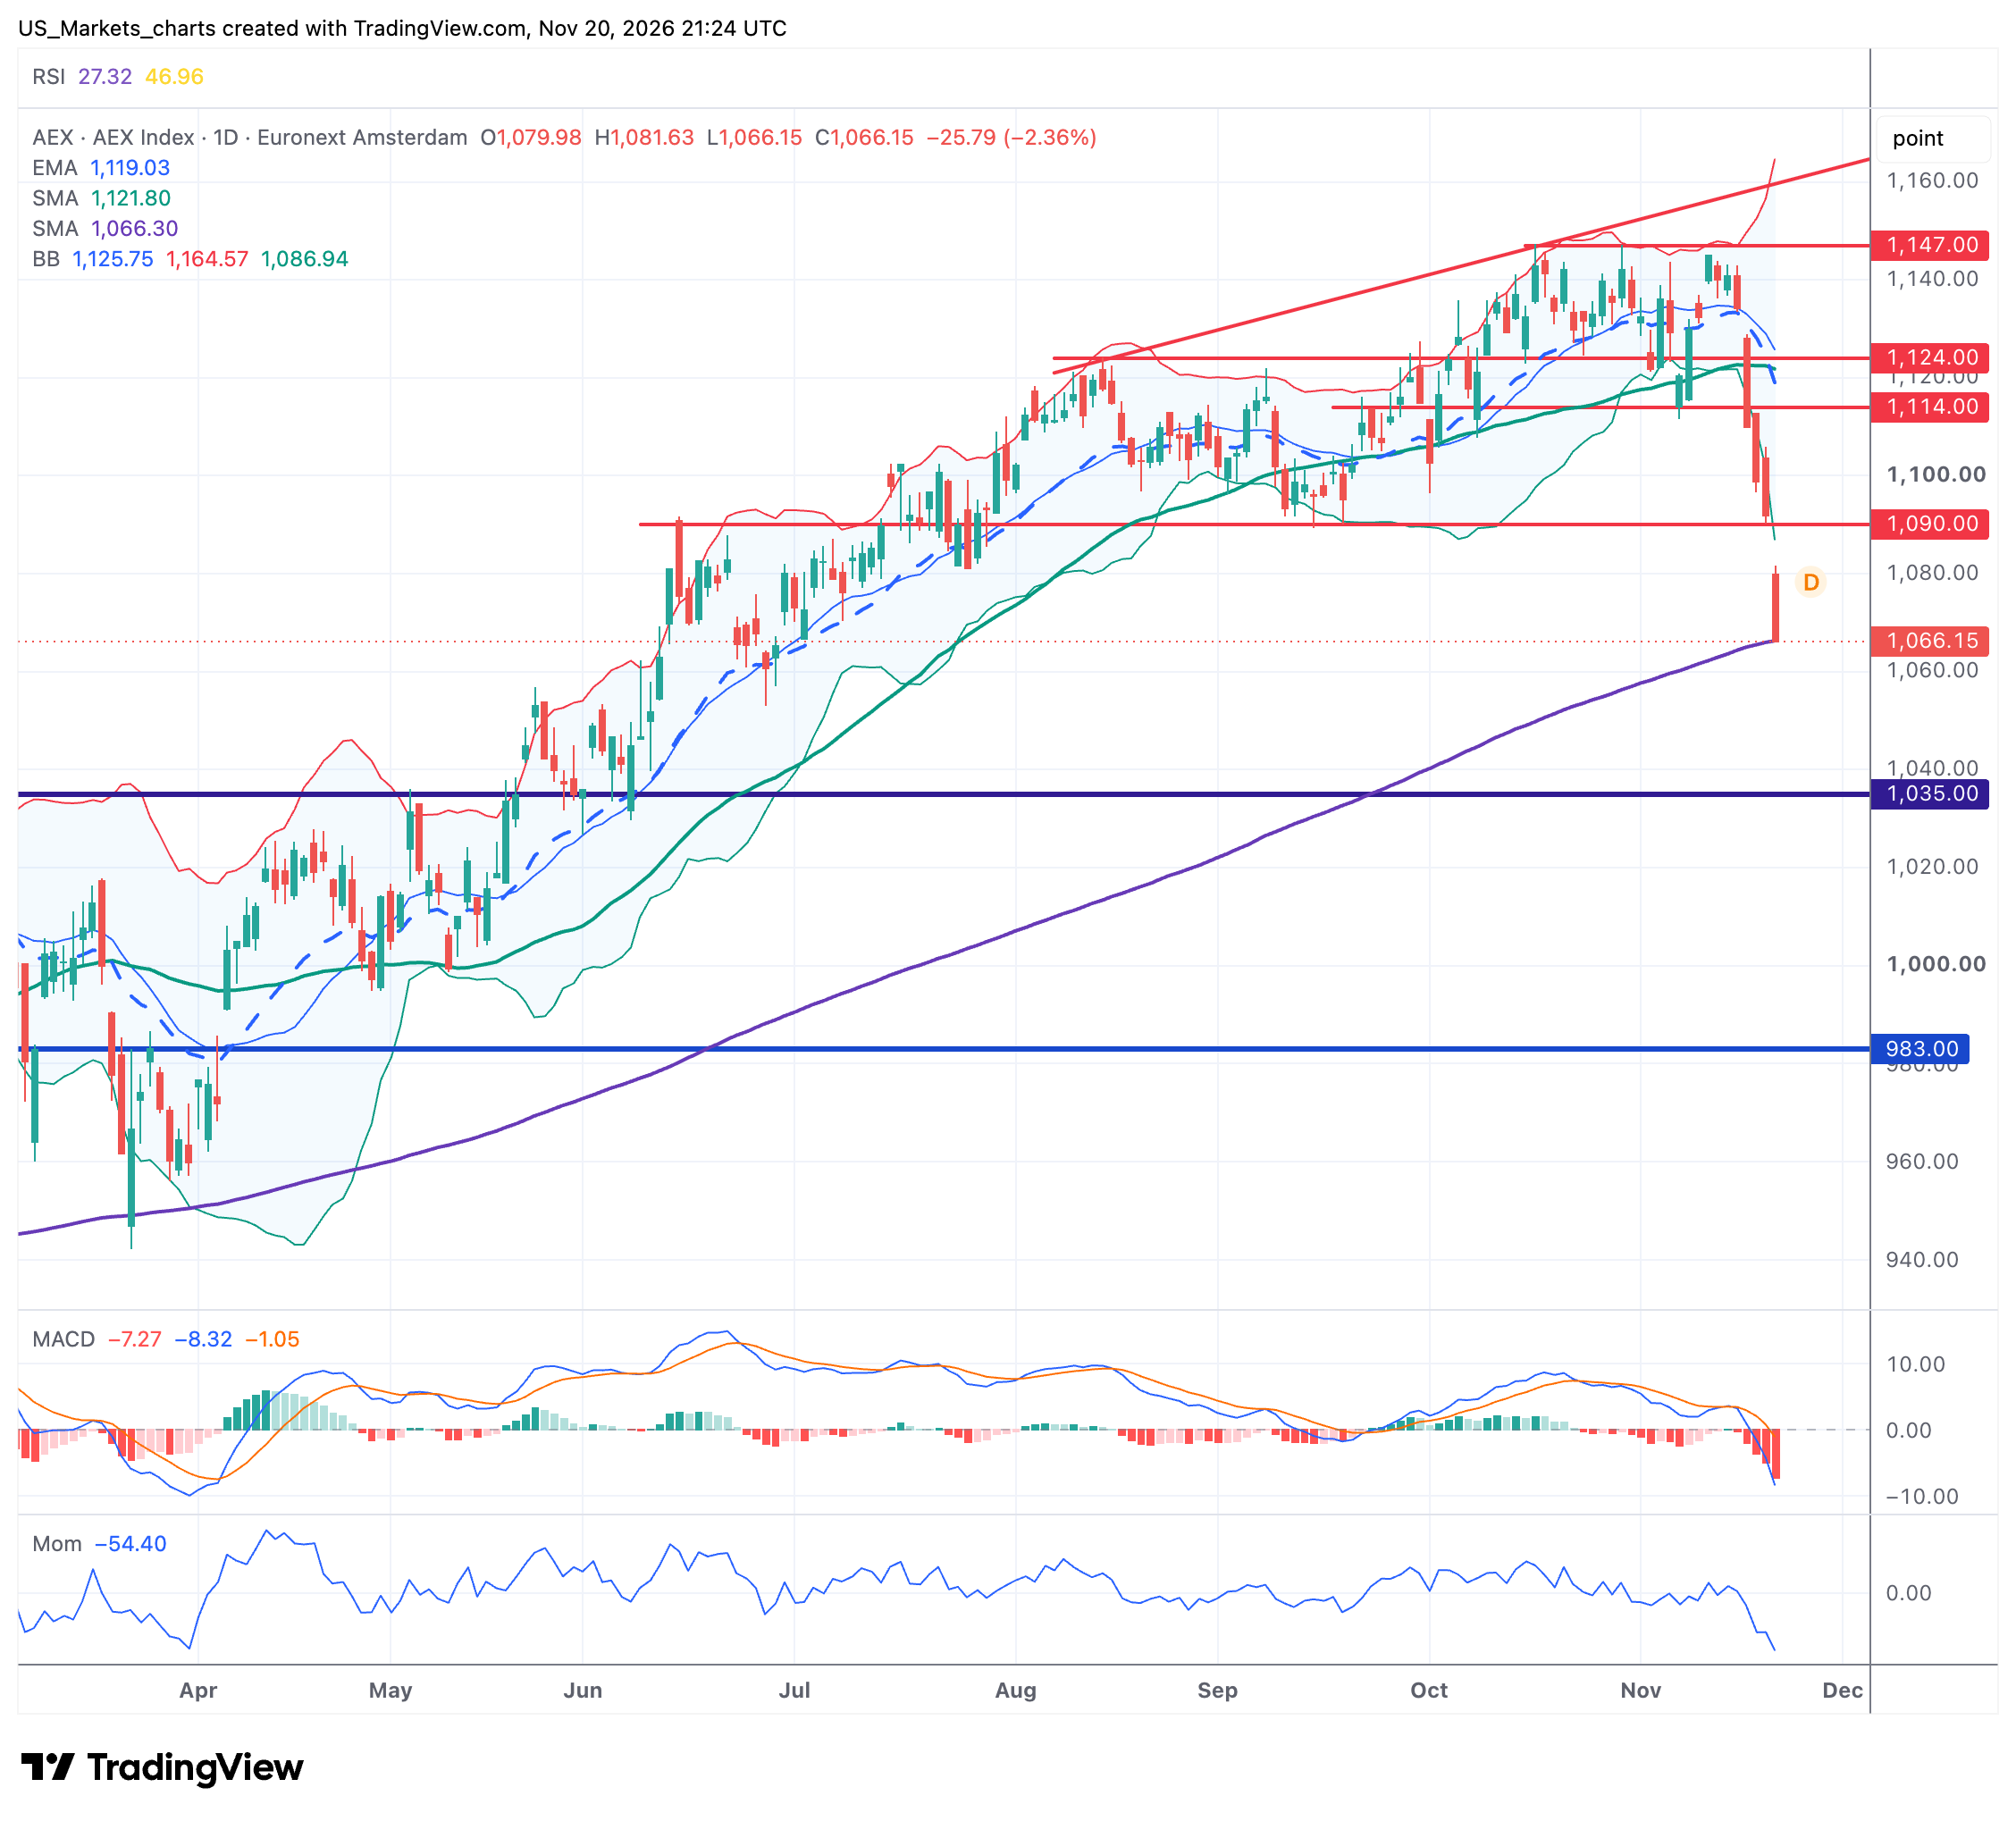
AEX Index AEX
VRIJDAG -2.36%WEEK -6.32%
Click on the chart to view it at full size.
The AEX lost 2.36% on Friday and closed at 1,066, a weekly loss of 6.32%. This week the price broke through the rising trendline of the entire year and also fell below the EMA-20, which comes in at 1,120, and the SMA-50, which comes in at 1,122. The close is now almost exactly on the SMA-200, which comes in at 1,067, the 1st real test of that average since the rise began. Resistance is now at the 1,090 and the 1,114, the previous support levels of the uptrend.
In short
The price is no longer getting above the resistance at 1,090.
The SMA-200 is just about holding as support on Friday, by the skin of its teeth.
The SMA-50 is still above the SMA-200, so there is still no sign of a death cross for a long while.
The MACD is below zero, momentum is negative.
The RSI is now in oversold territory, clearly below 30. The MACD is below zero and below the signal line, momentum is negative. The Bollinger Bands show how far the price is from the 20 day average and how restless the market is. The bands widened strongly this week, the price is trading in the lower half of the band, a sign of increased unrest.
For the coming sessions the test of the SMA-200 is the central point. If that average holds, a countermove towards 1,090 is possible from the oversold RSI. The price is still far from getting above the resistance at 1,114 as long as the broader market remains under pressure. A close below the SMA-200 makes a further decline more likely.
05 • Market psychology
Fear dominates, discipline wins
Weeks like this are a test for every investor. When all 10 indices close in the red and the VIX shoots up by dozens of % in just a few days, the temptation to sell in panic feels strongest, precisely at the moment when it makes the least sense.
We often point out that fear and greed are the 2 biggest enemies of an investor, and that periods of extreme fear often form the breeding ground for the best entry points. A 'margin call' forces many parties to sell at the worst possible moments, which can further amplify a move down without any new fundamental news behind it.
Trader Guy, who has followed the market and above all market psychology for many years, stresses that this is the moment to keep a cool head. Do not buy blindly because everything suddenly looks cheaper, and do not sell everything in panic because the news suddenly sounds too gloomy. A clear plan with predetermined levels and choices prevents emotion from taking over your decisions.
The flight to safety was hard to find this week in gold, silver and bitcoin, which like virtually all other assets closed sharply lower. Yields on 10 and 30 year bonds did fall, as investors fled into US Treasuries during the panic on the stock market. The VIX shot up 91.16% to 35.90, a level that points to great nervousness among investors.
07 • Outlook Week 48
A short week with the PCE as the main act
Next week is a shortened trading week because of Thanksgiving. The exchanges in the United States are fully closed on Thursday 26 November and Friday 27 November, the day of Black Friday, is a shortened session. Many of the usual macro figures are therefore brought forward to Wednesday.
The most important figure of the week is the US PCE inflation on Wednesday, the preferred measure of the Fed. In addition there are the preliminary purchasing managers indices and the Conference Board consumer confidence, in a week in which investors are also watching the aftermath of the correction and any further developments around the SEC investigation into Nvidia.
Macro agenda for the coming week
Monday 23 November: preliminary purchasing managers indices US and eurozone, German Ifo index. Tuesday 24 November: US house prices Case Shiller, Conference Board consumer confidence. Wednesday 25 November: PCE inflation, personal income, durable goods orders, weekly jobless claims. Thursday 26 November: Thanksgiving, Wall Street closed. Friday 27 November: Black Friday, short trading session on Wall Street.
Disclaimer: Investing involves risks, you can lose all or part of your investment. This newsletter is for information purposes only and does not constitute individual investment advice.
All information in this newsletter has been checked as well as possible, but much of it is now generated with AI, so there may still be a few small errors in it.
Sources: Investing.com, TradingView, Yahoo Finance, MarketWatch, TheStreet.com, CNBC, Reuters and own price data USMarkets.nl.
Disclaimer: deze update is geen beleggingsadvies. Alle informatie in deze update werd zo goed als mogelijk gecontroleerd, maar veel wordt tegenwoordig gegenereerd met behulp van AI, dus er kunnen eventueel nog foutjes tussen zitten.
Guy Systeem Trading
Aanbieding:
Nieuwe leden nu
tot 1 FEB
voor
€ 25,00.
Verlenging na aanbieding
€ 60,00per maand.
U mag 1 keer per jaar gebruik maken van een aanbieding !!
Je kunt altijd volgen, je maakt zelf de keuze
Polleke Trading
Aanbieding:
Nieuwe leden nu
tot 1 FEB
voor
€ 35,00.
Verlenging na aanbieding
€ 80,00per maand.
U mag 1 keer per jaar gebruik maken van een aanbieding !!
Je kunt altijd volgen en houdt zelf de controle
US Markets Combi-Abonnement
Aanbieding:
Nieuwe leden nu
tot 1 FEB
voor
€ 50,00.
Verlenging na aanbieding
€ 100,00per maand.
U mag 1 keer per jaar gebruik maken van een aanbieding !!